How to select and tag certain regions of an image using OpenCV
This recipe helps you select and tag certain regions of an image using OpenCV
Recipe Objective: How to select and tag certain regions of an image using OpenCV?
This recipe explains how to tag an area in an image using OpenCV. This is heavily used in the object detection of images.
Learn to Implement Deep Learning Techniques for Medical Image Segmentation
Table of Contents
Step 1: Importing library and reading the images
First, let us import the library and read the image in default mode using the cv2.imread() function. The image that we are using in this recipe is the one below.


import cv2

image = cv2.imread('project.jpg')
Step 2: Tagging an area in the image
Now we have our image store in the image variable. Let us now try to tag an area in the image using the cv2.rectange() function. This function returns the pixel values of the area that we select in the image. This function takes the following parameters as input.
- img: Image on which we have to draw the rectangle for the tagged area
- pt1: Starting coordinates of the rectangular area to be drawn. This accepts values in the order (left, top)
- pt2: Ending coordinate of the rectangular area to be drawn. This accepts values in the order (right, bottom)
- color: Color of the rectangle to be drawn. This accepts values in the form of (R, G, B)
- thickness: Thickness of the rectangle. This accepts integer values
Let us try to tag a 20 X 20 square in the top left of the image. Then we would have
- left = 0
- top = 0
- right = 20
- bottom = 20
cv2.rectangle(img=image, pt1=(0, 0), pt2=(20, 20), color=(0,0,255), thickness=2)
It returns an array of pixels in the selected area and draws a rectangle in the chosen area
Output:
    array([[[  0,   0, 255],
        [  0,   0, 255],
        [  0,   0, 255],
        ...,
        [ 91,  57,  34],
        [ 91,  57,  34],
        [ 91,  57,  34]],

       [[  0,   0, 255],
        [  0,   0, 255],
        [  0,   0, 255],
        ...,
        [ 91,  57,  34],
        [ 91,  57,  34],
        [ 91,  57,  34]],

       [[  0,   0, 255],
        [  0,   0, 255],
        [ 81,  50,  29],
        ...,
        [ 91,  57,  34],
        [ 91,  57,  34],
        [ 91,  57,  34]],

       ...,

       [[ 82,  49,  29],
        [ 82,  49,  29],
        [ 82,  49,  29],
        ...,
        [ 92,  58,  35],
        [ 92,  58,  35],
        [ 92,  58,  35]],

       [[ 82,  49,  29],
        [ 82,  49,  29],
        [ 82,  49,  29],
        ...,
        [ 92,  58,  35],
        [ 92,  58,  35],
        [ 92,  58,  35]],

       [[ 82,  49,  29],
        [ 82,  49,  29],
        [ 82,  49,  29],
        ...,
        [ 92,  58,  35],
        [ 92,  58,  35],
        [ 92,  58,  35]]], dtype=uint8)
Step 3: Displaying the Image
Now let us display the image and see if we have tagged the rectangular area correctly in the image using the cv2.imshow() function. This function displays the picture in a separate window. The cv2.imshow() requires two parameters to be passed as input. Those are as follows
- winname: Name of the window
- mat: Pixel array of the image we want to display
The cv2.waitkey() function determines how long the window should display the image. This function expects an integer value as an input parameter that denotes the window's duration in milliseconds. For instance, if we pass 5000 as input like cv2.waitkey(5000), the window will display the image for 5 seconds and close automatically.
If we pass 0 as an input parameter to the cv2.waitkey() function, the window waits for an infinite duration until we manually close the window.
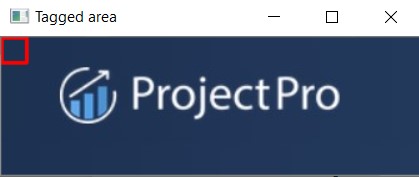
cv2.imshow("Tagged area", image)
cv2.waitKey(0)
Output:
If we look at the output image below, we can see a red box in the top-left area of the image.
Download Materials

What Users are saying..

Ray han
I think that they are fantastic. I attended Yale and Stanford and have worked at Honeywell,Oracle, and Arthur Andersen(Accenture) in the US. I have taken Big Data and Hadoop,NoSQL, Spark, Hadoop... Read More