What are Sobel and Scharr derivatives in OpenCV
This recipe explains what are Sobel and Scharr derivatives in OpenCV
Recipe Objective: What are Sobel and Scharr derivatives in OpenCV?
In this recipe, let us understand what Image derivatives are and why they are essential. Let us also discuss a few methods which help us in extracting the derivatives of an image.
Table of Contents
Step 1: Import the libraries and read the image.
Let us first import the necessary libraries and read the image. The image that we are using here is the one shown below.

import numpy as np

import cv2

from matplotlib import pyplot as plt

image = cv2.imread('chess.jpg',0)
Step 2: Understanding image derivatives
Before we start extracting the image derivatives using OpenCV, let us first take a moment to understand what image derivatives are and why they are helpful. Image derivatives are highly used in detecting the edges of the image. Image derivatives locate the places in the image where the pixel intensity changes in a drastic manner. This helps us map the boundaries of any image.
Step 3: Calculating the derivative of an image using Sobel Operator
The Sobel operator is one of the available techniques to extract the derivative of an image. It is a combination of Gaussian Smoothing and differentiation. We can locate the vertical and the horizontal edges separately or together using the cv2.Sobel() function, which takes the following arguments.
- src: The input image
- ddepth: The data type of the output image
- dx: Degree of the X derivative
- dy: Degree of the Y derivative
- ksize: (Optional) The size of the kernel matrix
We already know that the data type of our input image would be uint8. Generally, the derivates of Black to White transitions are positive. In contrast, the White to Black transitions are negative, and hence it is highly recommended to choose a higher-order output datatype such as cv2.CV_64F and then convert the result to a uint8 type array to avoid missing any edges.
sobel_X = cv2.Sobel(image, cv2.CV_64F, 1, 0)

sobel_X_abs = np.uint8(np.absolute(sobel_X))
sobel_Y = cv2.Sobel(image, cv2.CV_64F,0, 1)

sobel_Y_abs = np.uint8(np.absolute(sobel_Y))
sobel_XY_combined = cv2.bitwise_or(sobel_Y_abs,sobel_X_abs)
In the above chunk of code, we calculate the X and Y derivates of the input image and store it in sobel_X and sobel_Y variables, respectively. We then take the absolute value of the result and convert it to a uint8 array using the np.absolute() and np.uint8() functions, respectively, available in the Numpy package.
We can also combine the results of the X and Y derivates using the cv2.bitwise_or() method.
Let us display the results using matplotlib.
titles = ['Original Image','Sobel X','Sobel Y', ' Sobel XY combined using OR ']
images = [image,sobel_X_abs, sobel_Y_abs, sobel_XY_combined]
plt.figure(figsize=(13,5))
for i in range(4):
    plt.subplot(2,2,i+1)
    plt.imshow(images[i],'gray')
    plt.title(titles[i])
    plt.xticks([])
    plt.yticks([])
plt.tight_layout()
plt.show()
Output:
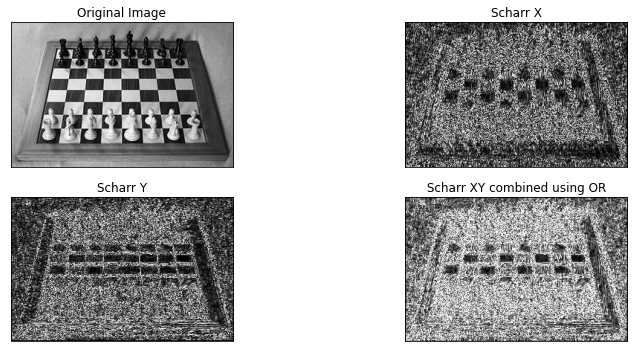
Step 4: Calculating the derivative of an image using Scharr Operator
Scharr is yet another operator which is used to find the derivative of an image. Scharr filter is said to give more accurate results where Sobel filter fails to work correctly. It is very similar to Sobel in terms of implementation using python. We can extract the Scharr derivative of an image using the cv2.Scharr() function, which takes the following arguments.
- src: The input image
- ddepth: The data type of the output image
- dx: Degree of the X derivative
- dy: Degree of the Y derivative
scharr_X = cv2.Scharr(image, cv2.CV_64F, 1, 0)

scharr_X_abs = np.uint8(np.absolute(scharr_X))
    scharr_Y = cv2.Scharr(image, cv2.CV_64F, 0, 1)

scharr_Y_abs = np.uint8(np.absolute(scharr_Y))
scharr_XY_combined = cv2.bitwise_or(scharr_Y_abs,scharr_X_abs)
Let us display the results using matplotlib.
titles = ['Original Image','Scharr X','Scharr Y', ' Scharr XY combined using OR ']
images = [image,scharr_X_abs, scharr_Y_abs, scharr_XY_combined]
plt.figure(figsize=(13,5))
for i in range(4):
    plt.subplot(2,2,i+1)
    plt.imshow(images[i],'gray')
    plt.title(titles[i])
    plt.xticks([])
    plt.yticks([])
plt.tight_layout()
plt.show()
Output:


What Users are saying..

Savvy Sahai
As a student looking to break into the field of data engineering and data science, one can get really confused as to which path to take. Very few ways to do it are Google, YouTube, etc. I was one of... Read More