


Head of Data science, OutFund

Senior Data Engineer, National Bank of Belgium

Senior Data Engineer, Slintel-6sense company

Principal Software Engineer, Afiniti
Given big data at taxi service (ride-hailing) i.e. OLA, you will learn multi-step time series forecasting and clustering with Mini-Batch K-means Algorithm on geospatial data to predict future ride requests for a particular region at a given time.
What is multi-step time series forecasting
Get started today
Request for free demo with us.


Schedule 60-minute live interactive 1-to-1 video sessions with experts.
Unlimited number of sessions with no extra charges. Yes, unlimited!
Give us 72 hours prior notice with a problem statement so we can match you to the right expert.
Schedule recurring sessions, once a week or bi-weekly, or monthly.
If you find a favorite expert, schedule all future sessions with them.
Source: ![]()
Source: ![]()
Source: ![]()
Source: ![]()
Source: ![]()
Source: ![]()
Source: ![]()
Source: ![]()
Source: ![]()
Source: ![]()
Source: ![]()
Source: ![]()
Source: ![]()
250+ end-to-end project solutions
Each project solves a real business problem from start to finish. These projects cover the domains of Data Science, Machine Learning, Data Engineering, Big Data and Cloud.
15 new projects added every month
New projects every month to help you stay updated in the latest tools and tactics.
500,000 lines of code
Each project comes with verified and tested solutions including code, queries, configuration files, and scripts. Download and reuse them.
600+ hours of videos
Each project solves a real business problem from start to finish. These projects cover the domains of Data Science, Machine Learning, Data Engineering, Big Data and Cloud.
Cloud Lab Workspace
New projects every month to help you stay updated in the latest tools and tactics.
Unlimited 1:1 sessions
Each project comes with verified and tested solutions including code, queries, configuration files, and scripts. Download and reuse them.
Technical Support
Chat with our technical experts to solve any issues you face while building your projects.
7 Days risk-free trial
We offer an unconditional 7-day money-back guarantee. Use the product for 7 days and if you don't like it we will make a 100% full refund. No terms or conditions.
Payment Options
0% interest monthly payment schemes available for all countries.
I am the Director of Data Analytics with over 10+ years of IT experience. I have a background in SQL, Python, and Big Data working with Accenture, IBM, and Infosys. I am looking to enhance my skills in Data Engineering/Science and hoping to find real-world projects fortunately, I came across Project Pro. Project Pro helped me by providing an in-depth explanation of the end-to-end real-world data engineering projects. From data extraction, transformation, and storage up to data visualization. I learned more about Kafka, AWS, NI-FI, and Spark. Thru the help of the knowledge I gained from Project Pro, I was able to do well in the coding exams, interview and helped me land a job at EY. I will recommend every aspiring data professional as well as existing data science/engineer expert to try Project Pro to enhance their knowledge.
Ed Godalle
Director Data Analytics at EY / EY Tech
I think that they are fantastic. I attended Yale and Stanford and have worked at Honeywell,Oracle, and Arthur Andersen(Accenture) in the US. I have taken Big Data and Hadoop,NoSQL, Spark, Hadoop Admin, Hadoop projects. I have been happy with every project. They have really brought me into the forefront of Data Science and Big data. I would recommend this to everyone. It is more than worth the price. After working with them I feel so much more employable for current projects.
Ray han
Tech Leader | Stanford / Yale University
ProjectPro is a unique platform and helps many people in the industry to solve real-life problems with a step-by-step walkthrough of projects. A platform with some fantastic resources to gain hands-on experience and prepare for job interviews. I would highly recommend this platform to anyone looking to upskill and stay updated with the latest projects and solutions. Overall this platform is awesome and worth the money spent as we get a lot of value out of it and helps soar our career to greater heights.
Anand Kumpatla
Sr Data Scientist @ Doubleslash Software Solutions Pvt Ltd
I come from a background in Marketing and Analytics and when I developed an interest in Machine Learning algorithms, I did multiple in-class courses from reputed institutions though I got good theoretical knowledge, the practical approach, real word application, and deployment knowledge were missing. ProjectPro helped me bridge that gap. ProjectPro has real-time projects that helped me improve my skills. What I liked most is that I get exposure to so many projects, given the work nature I wouldn't have gotten exposure to such a variety of projects and their approaches. It is helping me apply knowledge to other projects too. I highly recommend ProjectPro to everyone who wants to excel in their DataScience career.
Ameeruddin Mohammed
ETL (Abintio) developer at IBM
Head of Data science, OutFund
Senior Data Engineer, National Bank of Belgium
Senior Data Engineer, Slintel-6sense company
Principal Software Engineer, Afiniti
Global Data Community Lead | Lead Data Scientist, Thoughtworks
Director of Business Intelligence , CouponFollow
Senior Applied Scientist, Amazon
Senior Data Scientist, Mawdoo3 Ltd
University of Economics and Technology, Instructor
Data Engineering Manager, Microsoft Corporation
Data and Blockchain Professional
Senior Data Engineer, Publicis Sapient
Data Scientist, Inmobi
Big Data Engineer, Beyond Limits
Data Science, Yelp
Machine Learning Manager, Adobe
Dev Advocate, Pinecone and Freelance ML
Data Engineer, Microsoft
Principal Data Scientist - Cyber Security Risk Management, Verizon
Chief Science Officer at DataPrime, Inc.
Data Science Consultant, Fractal Analytics
Data Scientist, Boeing
Chief Scientific Officer, Machine Medicine Technologies
Head of Data Science, Slated
Director of Data Science & AnalyticsDirector, ZipRecruiter
Big Data & Analytics architect, Amazon
Data Engineer - Capacity Supply Chain and Provisioning, Microsoft India CoE
Senior Data Engineer, Hogan Assessment Systems
Data Scientist, Credit Suisse
Data Engineering Lead - Uber
Data Scientist, SwissRe
Senior Data Platform Engineer, GoodRx
NLP Engineer, Speechkit
The taxi service (ride-hailing) industry has rapidly grown over the past few years. Taxi car drivers must choose where to hang tight waiting for passengers as they can get somebody quickly. Passengers also prefer a quick taxi service whenever needed. We all have faced problems with taxi booking requests, that sometimes cannot be fulfilled or the wait time for ride arrival is very long due to the unavailability of a nearby taxi. One should feel fortunate if you get a taxi booked in one go.
Taxi demand prediction has become extremely important for taxi-hailing (and e-hailing app) companies to understand their demand and optimize their fleet management.
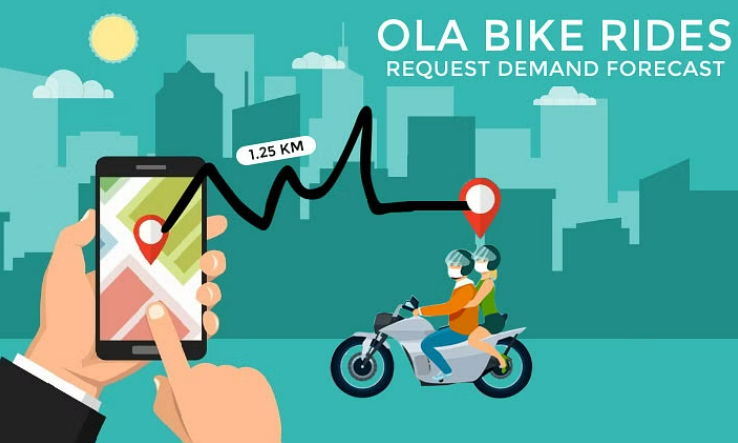
Bike ride request demand forecasting using machine learning is significant because it enables companies and organizations to optimize resource allocation, improve operational efficiency, and enhance customer satisfaction. By accurately predicting how many people will be looking for bike rides at different times and places, businesses can ensure enough bikes and riders are available when and where they are most needed. Businesses can, therefore, maximize their resources, cut costs, and provide customers with top-quality service using bike ride request predictions. So, it's a win-win situation!
However, Ola Bikes are suffering losses and losing out from its competition due to its inability to fulfill the ride requests of many users. To tackle this problem, we must predict ride demand within the Ola app in a certain town/region and a given future time window. We will build a model based on users' ride request dataset, containing features: ride booking date and time, pickup point, and destination latitude-longitude. This model would forecast the demand for such trips at a particular time in different city areas, which would help the company optimize taxi concentration to fulfill users' demands.
This ML mini project aims to develop a model to predict ride requests (demand forecast) for a particular town, latitude, and longitude for a requested future time window/duration.
Here are the key learning takeaways from the Ola Bike Rides Request ML project-

You will learn about multi-step time series forecasting and its various concepts, along with the different approaches one can use to solve a multi-step time series forecasting business problem.
You will learn how to perform data exploration and cleaning on raw datasets, including handling missing values, removing outliers, null values, etc. You will also learn how to preprocess and prepare the data using Geospatial feature engineering and Mini-Batch K-Means clustering techniques.
Working on this project will also help you understand the concepts of correlation, lead-lag relationships, evaluation metrics like Root Mean Square Error (RMSE), etc.
This machine learning project will help you better understand how to implement various machine learning algorithms (Linear Regression, Random Forest, and XGBoost) to build a multi-step time series forecasting model and determine the best-performing model based on the evaluation metrics.
Let us understand the various steps involved in the working approach of this Ola bike ride ML mini project in detail-
For this bike ride ML project, you will work with the raw_ride_request Ola dataset, which has all the details of ride requests from customers across India for an entire year. The raw Ola dataset comprises several key data points, including a unique identifier for each user, the date and time (in IST) of the ride request, as well as the latitude and longitude coordinates for both the pickup and drop-off destinations. These specific details provide crucial information for analyzing and predicting ride demand patterns. By leveraging this dataset, researchers and analysts can gain insights into various aspects of Ola's bike ride services, enabling them to develop accurate demand prediction models and optimize operational strategies.
Below are the data fields present in the raw Ola dataset-
number: unique id for every user
ts: DateTime of booking ride (IST time)
pick_lat: ride request pickup latitude
pick_lng: ride request pickup longitude
drop_lat: ride request drop latitude
drop_lng: ride request drop longitude

The first step of the Ola bike ride ML project code shows you how to load the raw dataset (raw_data.csv) and explore it to determine the total number of rows (83,81,556 rows) and remove the duplicate ones (1,13,540 duplicate entries). It also shows you how to determine the null values in the dataset and remove them. You will also learn to analyze the remaining dataset features and perform advanced data cleaning, for example, calculating the number of multiple bookings on the Ola app by the same user_ID using timestamps.
After data cleaning, the next step in the demand forecasting project code is to preprocess and prepare the data using Geospatial feature engineering. Working on this ML prediction project will show you how to perform Geospatial feature engineering since you cannot directly feed real-time input values, such as pickup_lat and pickup_long, to any ML model.
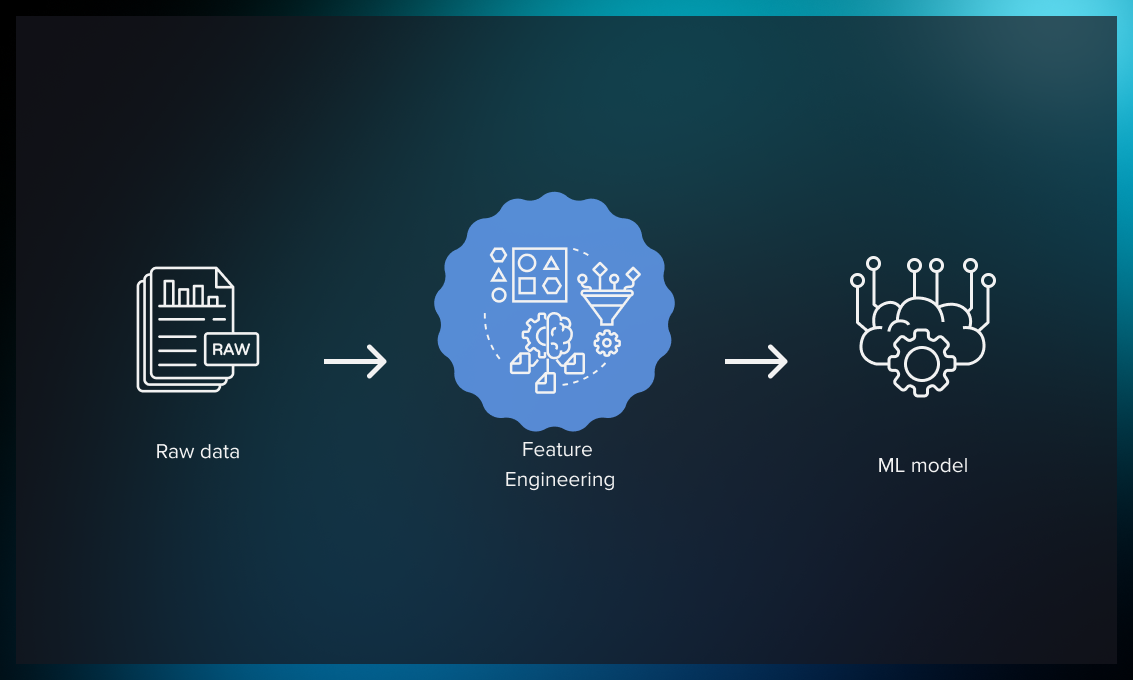
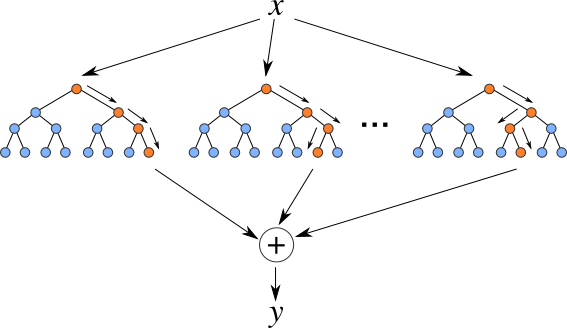
You will learn how to apply a Mini-batch K-Means clustering algorithm on these input features to determine which region the demand is coming from. You will learn how to take several mini-batches subsets of the input data to reduce the computation time. The project will teach you how to break down the time feature into hour, minute, day, week, etc., that can be used within the ML model. You will learn how to perform advanced data analysis to determine the maximum correlation between ride requests using a HeatMap.
The project solution also involves determining the good and bad ride requests from the given dataset. Below are some of the guidelines followed in the project solution code while defining a good ride request-
Count only 1 ride request by a user if there are multiple bookings for any destination from the exact latitude and longitude within 1hour of the last booking time.
If there are ride requests within 8mins of the last booking time, consider only 1 ride request from a user (latitude and longitude may or may not be the same).
If the geodesic distance from the pickup and drop point is less than 50 meters, consider that ride request a fraud ride request.
Consider all ride requests where pick up or drop point is outside India bounding box: ["6.2325274", "35.6745457", "68.1113787", "97.395561"] as a system error.
Karnataka is the prime city being focused upon in the given data, which has a lot of drivers and ride requests to fulfill. The ride-sharing services cannot serve rides outside Karnataka and have pickup and drop distances> 500 km. Karnataka bounding box: ["11.5945587", "18.4767308", "74.0543908", "78.588083"]
This project involves working with various machine learning algorithms/models, such as Linear Regression, Random Forest, and XGBoost. It also involves using metrics like Root Mean Square to evaluate the model’s performance.
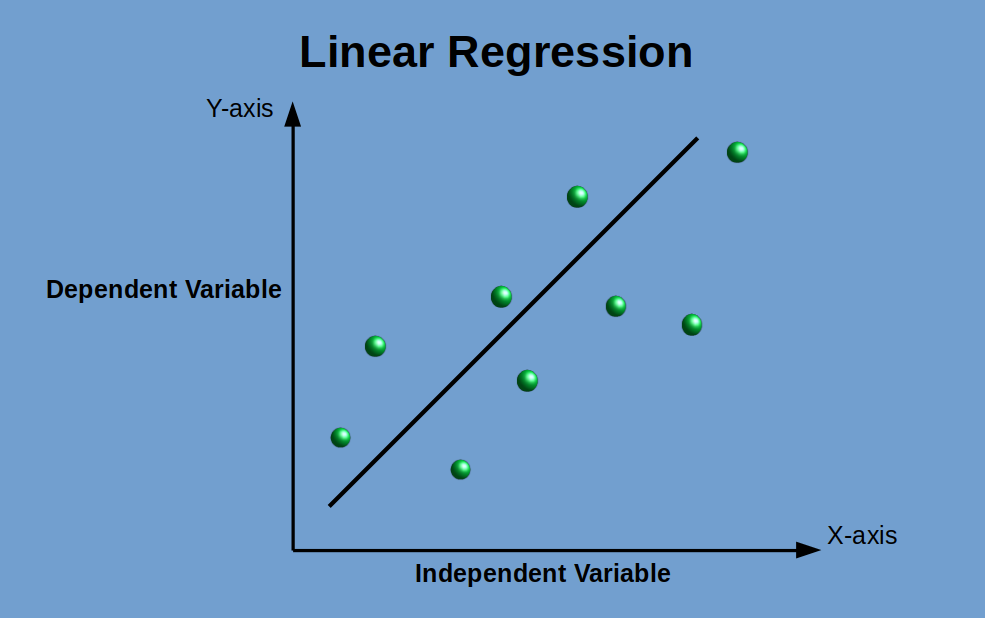
By working on this project, you will understand how a Linear Regressor model tends to underfit the training dataset and doesn’t work well when the data is non-linear, i.e., there is no linear relationship between the variables.
By working on this project, you will understand how a Random Forest model tends to overfit on the training dataset and doesn’t work well for this particular dataset by comparing the RMSE values for training and testing datasets.

Once you apply the XGBoost model to the training dataset, you will observe that the RMSE values are higher for the dataset than the Random Forest regressor model. This shows that an XGBoost predictive model works better for non-linear datasets than other models. You will also learn how plotting a feature importance graph can help you determine the importance of the clusters, for instance, the pickup cluster has the highest importance, etc.
After model development, we will build a prediction pipeline to deploy the model. To test the prediction pipeline, we will use clean data (filtered ride requests data based on good ride definition conditions) for the date 2021-03-26, based on which we have to predict/show the initial hours' rides request demand forecast for the date 2021-03-27.
Below are some key use cases of bike ride request demand predictions across different industries-
Ride-Sharing Companies- Ride-sharing companies like Uber, Lyft, and Ola utilize ML and data science to forecast bike ride requests. These platforms/apps can accurately predict bike ride demand, optimize ride options and allocation, provide exciting offers, and reduce customer wait times by analyzing historical trip details, user patterns, weather conditions, and other factors.
Food Delivery Services- Food delivery platforms like Deliveroo, Zomato, Swiggy, etc., employ ML and data science techniques for forecasting bike ride requests. By analyzing historical order data, time of day, and customer behavior, these platforms/apps can predict peak demand periods, optimize delivery routes using onboard GPS, and allocate delivery riders efficiently to ensure timely deliveries.
Logistics And Delivery Companies- Logistics and delivery companies, such as DHL, E-kart, BlueDart, etc., utilize ML and data science to forecast bike ride requests in delivery operations. These companies can optimize bike delivery route navigation, allocate resources effectively, and improve delivery efficiency by analyzing historical data, traffic patterns, and customer preferences.
Tourism Services- Bike rental services catering to tourists and sightseeing activities employ machine learning and data science for demand forecasting. These services can predict bike demand during different seasons by analyzing historical data, events, and popular routes, optimizing their rental inventory and service offerings accordingly.
Let us briefly explore some real-world examples of bike ride service providers which leverage bike ride request demand forecasting using data science and machine learning approaches.
Ola- Ola, one of the largest ride-sharing companies in India, utilizes machine learning for bike ride request demand forecasting. By analyzing historical ride data, weather conditions, events, and other factors, Ola can accurately predict demand patterns for bike taxis. This helps them optimize their customer management, ensuring that Ola bikes are available in the right locations at the right times, improving customer satisfaction, and reducing wait times.
Lime- Lime, a leading electric scooter and bike-sharing company, leverages machine learning to forecast bike ride requests. By analyzing data on rider behavior, historical usage patterns, and certain external factors such as weather and local events, Lime can predict demand fluctuations and optimize the distribution of their bikes. This allows Lime to manage its services efficiently, ensuring that bikes are available in high-demand areas, increasing rider accessibility, and improving the overall customer experience.
Uber- Another popular global transportation network company, Uber incorporates machine learning for forecasting bike ride requests. By analyzing customer data, such as historical ride data, time of day, location, and rider preferences, Uber can accurately predict the demand for bike rides in different areas. This enables them to optimize their bike-sharing services, ensuring sufficient bikes are available in high-demand areas, reducing customer wait times, and maximizing resource utilization.
Deliveroo- Deliveroo, a popular food delivery app, uses machine learning to forecast bike ride requests for its delivery riders. By analyzing historical order data, time of day, and customer preferences, Deliveroo can strategically predict peak demand periods and allocate delivery riders. This enables them to ensure timely deliveries, optimize their delivery routes, and provide efficient service to customers.
Grab- Grab, a Southeast Asian ride-hailing and delivery app, employs machine learning for bike ride request demand forecasting. By analyzing data on rider behavior, historical usage patterns, traffic conditions, and local events, Grab can accurately predict the demand for bike rides in different areas and at different times. This helps them optimize their bike allocation, ensuring sufficient bikes are available in high-demand areas, minimizing customer wait times, and thus, enhancing customer satisfaction.
Recommended
Projects
30+ NumPy Interview Questions and Answers for Data Analysts
Prepare for success in data analyst interviews with our curated list of 30+ NumPy Interview Questions and Answers. | ProjectPro
How to Learn Airflow From Scratch in 2024?
The ultimate curated collection of premier resources tailored to guide you to learn Apache Airflow from the ground up in 2024. | ProjectPro
Get a free demo
ProjectPro
![]()
![]()
![]()