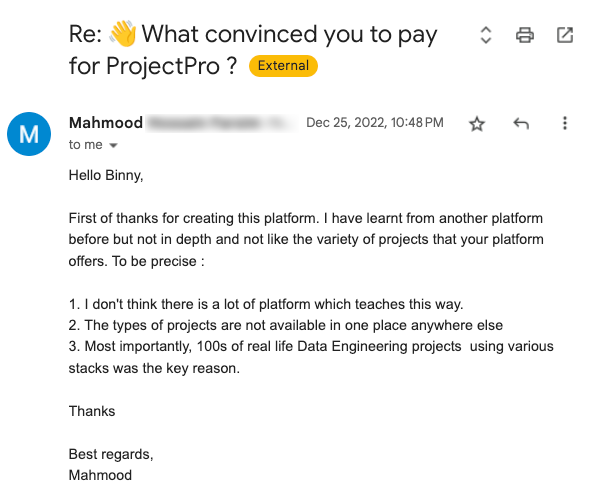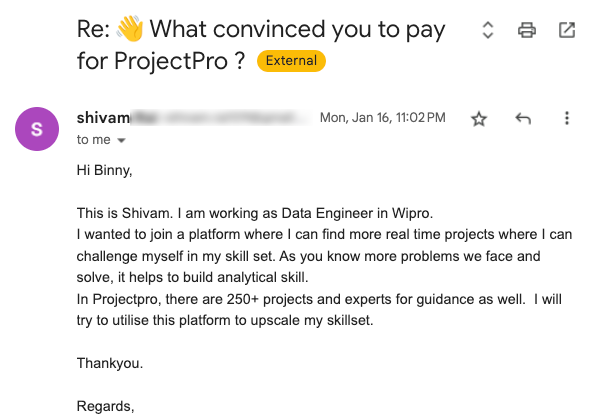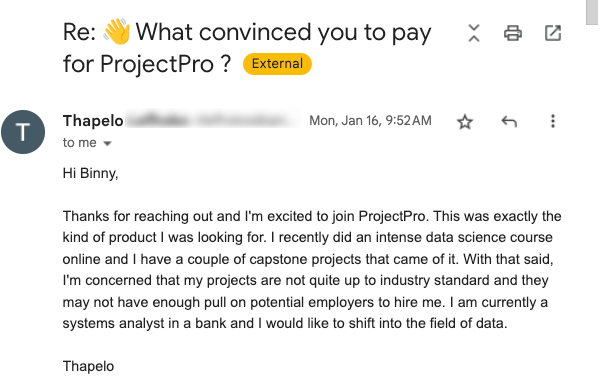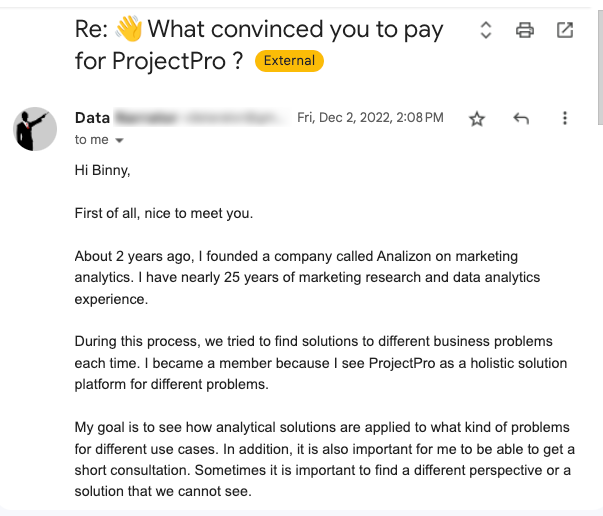
Data Engineering Lead - Uber

Data Scientist, Inmobi

Chief Science Officer at DataPrime, Inc.

Data Engineer, Microsoft
Learn to perform 1) Twitter Sentiment Analysis using Spark Streaming, NiFi and Kafka, and 2) Build an Interactive Data Visualization for the analysis using Python Plotly.
Get started today
Request for free demo with us.
Schedule 60-minute live interactive 1-to-1 video sessions with experts.
Unlimited number of sessions with no extra charges. Yes, unlimited!
Give us 72 hours prior notice with a problem statement so we can match you to the right expert.
Schedule recurring sessions, once a week or bi-weekly, or monthly.
If you find a favorite expert, schedule all future sessions with them.
Source: ![]()
Source: ![]()
Source: ![]()
Source: ![]()
Source: ![]()
Source: ![]()
Source: ![]()
Source: ![]()
Source: ![]()
Source: ![]()
Source: ![]()
Source: ![]()
Source: ![]()
250+ end-to-end project solutions
Each project solves a real business problem from start to finish. These projects cover the domains of Data Science, Machine Learning, Data Engineering, Big Data and Cloud.
15 new projects added every month
New projects every month to help you stay updated in the latest tools and tactics.
500,000 lines of code
Each project comes with verified and tested solutions including code, queries, configuration files, and scripts. Download and reuse them.
600+ hours of videos
Each project solves a real business problem from start to finish. These projects cover the domains of Data Science, Machine Learning, Data Engineering, Big Data and Cloud.
Cloud Lab Workspace
New projects every month to help you stay updated in the latest tools and tactics.
Unlimited 1:1 sessions
Each project comes with verified and tested solutions including code, queries, configuration files, and scripts. Download and reuse them.
Technical Support
Chat with our technical experts to solve any issues you face while building your projects.
7 Days risk-free trial
We offer an unconditional 7-day money-back guarantee. Use the product for 7 days and if you don't like it we will make a 100% full refund. No terms or conditions.
Payment Options
0% interest monthly payment schemes available for all countries.
What is Twitter Sentiment?
Twitter sentiment is a term used to define the analysis of sentiments in the tweets generated by users on social media platform like Twitter. Generally, twitter sentiments are analysed in most of the projects using parsing. Analyzing sentiments of users on twitter is fruitful to companies for their product that is mostly focused on social media trends, users sentiments and future view of the online community.
Data Pipeline:
It refers to a system for moving data from one system to another. The data may or may not be transformed, and it may be processed in real time (or streaming) instead of batches. Right from extracting or capturing data using various tools, storing raw data, cleaning, validating data, transforming data into query worthy format, visualisation of KPIs including Orchestration of the above process is data pipeline.
What is the Agenda of the project?
Agenda of the project involves Real-time streaming of Twitter Sentiments with visualization web app. We first launch an EC2 instance on AWS, and install Docker in it with tools like Apache Spark, Apache NiFi, Apache Kafka, Jupyter Lab, MongoDB, Plotly and Dash. Then, supervised classification model is created using Data exploration, Bucketizing, Stratified sampling, Dataset splitting, Extracting the features using tokenizing, removing stop words, TF-IDF etc., Creating Pipeline, Training the model, Evaluating model with binary classification evaluation and Saving classified model. It is followed by Extraction using Apache NiFi and Apache Kafka, followed by Transformation and Load using MongoDB and finally Visualizing it using python plotly and Dash with the usage of graph and table app call-back.
Usage of Dataset:
Here we are going to use Twitter sentiments data in the following ways:
- Extraction: During extraction process, NiFi process and connections are set up followed by creation of twitter app in twitter developer account. The data is streamed from the twitter API using NiFi followed by creation of topics and publishing tweets in NiFi using apache Kafka.
- Transformation and Load: During transformation and load process, schema is extracted from the stream of tweets followed by reading of data form apache Kafka as streaming a dataframe with extraction and cleansing of twitter data and analyzing sentiments in tweets. Then data is written in MongoDB for the visualization in Dash.
Data Analysis:
From given website, data is downloaded containing text of review, rating of product and summary of review. Data is bucketized to label features followed by partitioning of data to homogenous sample..
Dataset is splitted in appropriate ratios following by features extraction using tokenisation, TF-IDF and logistic regression.
Data pipeline is created to train the model and evaluate it with binary classification evaluator followed by saving of classified model.
The extraction process is done using NiFi and Kafka, by streaming data from twitter API using NiFi and creating topics, publishing tweets using Kafka.
In transformation and load process, schema is extracted from twitter streams and data is read from Kafka as streaming dataframe.
Twitter data is extracted and cleansed followed by sentiment analysis of tweets.
Finally continuous data is loaded into MongoDB and data is visualized using scatter graph and table definitions in python plotly and Dash.
Recommended
Projects
30+ Python Pandas Interview Questions and Answers
Prepare for Data Science interviews like a pro! Check out our blog with 30+ Python Pandas Interview questions and answers. | ProjectPro
Microsoft Fabric - All-in-one AI-Powered Analytics Solution
Microsoft Fabric - The ultimate AI-driven analytics solution. From data integration to predictive modeling, revolutionize your decision-making process.|ProjectPro
Your A-Z Guide to AWS Data Engineer Certification Roadmap
The ultimate AWS Data Engineer Certification Roadmap - a step-by-step guide for mastering data engineering on Amazon Web Services. | ProjectPro
Get a free demo


