What is a Python List Data Structure?
List is one of the most versatile data structures in Python programming language that stores an ordered collection of items. The simplest way to understand this is to just imagine it to be like your monthly grocery shopping list , except that in your monthly grocery shopping list the items usually are listed in a separate line whereas in Python programming language we separate the items in the list using a comma (,). List data structures in python are mutable and the value of an element in the list can be changed. A list is always enclosed in brackets and the elements in a list can be accessed using its index which begins from 0.
Refer to this Python List Tutorial for in-depth understanding of List data strcuture concept in Python - Python Tutorial on List Data Structure
How to get the length of a Tuple data structure in Python?
len () function is used to get the length of a Tuple Data Structure in Python.
Example:
ProjectPro_DataScience_Tuple = (“Hadoop”,”Spark”, “Python”,”R Programming”, “NoSQL”)
print (“Number of Trainings Offered by ProjectPro is: len (ProjectPro_DataScience_Tuple));
Number of Trainings Offered by ProjectPro is: 5
What is a Python Dictionary Data structure?
Python Dictionaries are important data structures in programming used to associate or map items you want to store to keys you need to retrieve them. Just relate to dictionary data structure in Python to the address book where you have to find the address of a person by knowing their name. Here we associate keys (name) with values (address or contact information).Key in a python dictionary must be unique because if you have two people with the exact same name then you will not be able to find the correct information. The term dictionary is used for these data structures as they work exactly like an actual dictionary full of words. Python Dictionary data structures map keys of any immutable type like tuples, strings or numbers to heterogeneous values.
Consider any language, every word maps to a meaning, just like that in a python dictionary we map keys (words) to values (meanings). Python Dictionary data structures can be referred to like lookup tables where you one value to lookup another value. Every key in a python dictionary is separated from its value using a colon (:) symbol. A dictionary data structure in Python is enclosed in curly braces and the items in the dictionary are separated by commas, just like other data structures.
Python Dictionary Example:
dict = {'Name': ‘ProjectPro’, ‘Training’: ‘Hadoop’, 'Class': ‘Best’}
What happens if you try to delete the first element of the tuple tup [0] using the code del tup [0] from tup1 = (10, 20, 30, 40)?
Tuples in Python are immutable and the value cannot be deleted, edited or added. Trying to delete the first element from the tuple will results in an error as shown below -
Traceback (most recent call last):
File "<stdin>", line 1, in <module>
TypeError: 'tuple' object doesn't support item deletion
How will you add an index to Pandas Dataframe in Python?
When creating a dataframe using the Python pandas data science library there is an option to add input to the ‘index argument’ so that developers can have the desired index they want. If the index argument is not specified then the index for the dataframe begins with 0 and continues until the last row of the dataframe is encountered. Even though the index is specified automatically, developers can make one of the columns as the index by using the set_index () function.
What is difference between Standard Deviation and Standard Error of Mean?
Standard Deviation is a measure of scatter of the data values, that means how much the data values vary from one another. The Standard Error of Mean depicts the degree of accuracy of true mean of the population. It depends upon the value of the Standard Deviation as well as the size of the sample. The unit of SD and SEM is same as that of unit of data value and SEM will always be smaller than SD. The Standard Error of Mean (SEM) gets smaller as the size of data sample increases. This is because the mean of the large sample is more accurate and close to the mean of the true population. So, even if the data values of the larger sample is more scattered, it would generate a better approximation of the mean of the true population leading to smaller values of SEM.
What is Linear Regression Model?
Linear Regression is a way to model a relationship between dependent variables and one or more base (independent) variables. The job of Linear Regression model is to predict a scalar function where the independent variables accurately model the outcome for a dependent variable. The case of a single explanatory variable is called Simple Linear Regression. In linear regression, data are modeled using linear predictor functions, and unknown model parameters are estimated from the data.
What is Euclidean Distance Algorithm?
Euclidean Distance is the distance between two points in a plane. For example, consider two points A and B. The Euclidean distance between these two points is the length of the line segment connecting these two points AB. Euclidean distance algorithm is used in machine learning to classify data points based on their Euclidean distance from the set point or normal. Although Euclidean distance is not considered to be an appropriate metric for higher dimensional data classification.
What is K-Nearest Neighbor Algorithm?
K-nearest neighbor algorithm is a machine learning algorithm which is a non-parametric method used for regression and classification. In this method, the model would assume k number of random points in the data space and try to optimize the placement of these training points by minimizing the difference of consequential distance between points. The output of this algorithm is a class membership. Where the respective K points denotes the class and the object is classified based on the majority vote of its neighboring points.
What is Bayesian Model or Bayesian Network?
Bayesian model is a directed acyclic graph which depicts the conditional probabilities and dependencies of a set of random variable. The nodes in the directed acyclic graphs represents random variables which can be unknown parameters or latent variables or some observable quantities; whereas the edges in the Bayesian network/model represents conditional dependencies between these variables.
If any two nodes in the Bayesian model are not connected, it implies that they are conditionally independent of each other. Algorithms are applied on Bayesian models to obtain model learning and inferring correlation between random variables.
What is Gibbs Sampling Strategy?
Gibbs Sampling is a Monte Carlo Markov Chain model for acquiring a series of sample values that are approximated using a pre-defined multi-variable probability distribution function (joint pdf). Gibbs Sampling technique is mostly used Bayesian Inference. The marginal distribution of any subset of variables can be approximated by simply considering the samples for that subset of variables, ignoring the rest.
What are the packages available for Natural Language Processing?
There are various open source packages available online for Natural Language Processing depending upon the processing language and framework being used. CRAN task view aggregates R language packages that supports computational linguistic application like speech analysis, language analysis based on words, syntax, semantics and pragmatics.
- tm is a text mining package within R.
- OpenNLP is a collection of natural language processing tools, which perform application like tokenizer, sentence detector, syntactic parser and pos-tagger.
- RWeka is an interface to Weka. It provides an aggregation of machine learning algorithms for data mining and its written in Java.
- Natural Language Toolkit (NTLK) is a framework to create Python based application which can interact with natural human language.
- Standford CoreNLP is a set of Natural Language Analysis frameworks and tools, that can process language text input and analyze it using Named Entity Recognizer (NER), Part of Speech (POS) tagger, sentiment analysis and other NLP tools.
Natural Language Processing, Python Vs. R?
Both R and Python offer open source toolkit that assists in Natural Language Processing. The prominent difference both the languages is that R is used for analytics and Python can be used for application development along with Language Processing. Also, R has some limitations in terms of memory. For instance, R holds all data in active workspace in RAM. That means, that while running R on 32-bit system, we have a upper limit of 4 GB RAM for R to access. Python offer much more flexibility in that aspect but it lacks the wide discipline of tool kits available for R.
How to select features for random forest using varImp function?
Caret's train() function produce model equation that use selective features. Train() function create these models and they have a built-in feature selection. Predictor() method can be called upon these models to return a vector which contains the predictors/features used in the final model. Built-in feature selection typically couples the predictor search algorithm with the parameter estimation and are usually optimized with a single objective function.
How to find key trees/features from a trained random forest?
After training a random forest, the trees are stored in the estimator_ attribute. In order to extract a key_tree, first define its characteristics and features. Based on that individuals trees would be ranked and then can be sorted for further use.
The command forest.feature_importances_ can also be used to find the trees/features from a trained random forest. This command sorts input features based on their relative importance.
What are some useful Data Analysis tools?
Among many open source and free tools available on internet for Data Analysis, following are found to be most useful and important:
1. CSVKit-- It has a host of Unix-like command-line tools for importing, analyzing and reformatting comma-separated data files.
2. DataTables-- This jQuery plug-in creates sortable, searchable HTML tables from a variety of data sources; for example, an existing, static HTML table, a JavaScriptarray, JSON or server-side SQL.
3. Highcharts JS-- It is a JavaScript library which provides an easy way to create professional-looking interactive charts for the Web.
4. PowerPivot-- It is a Microsoft Excel Plugin which is used to handle big data sets more efficiently compared to the basic version of Excel.
5. Weave-- It a visualization platform allows creation of interactive dashboards with multiple, related visualizations -- for example, a bar chart, scatter plot and map.
6. Import.io-- It is used for data extraction through web sources. It requires an input for parameters and generates data which can be exported for analysis.
How SVM can be used for Reggression and Classification?
Support Vector Machines (SVM) use decision planes to make classification boundaries. A decision plane separates between a group of data points that belongs to different class association. A linear classifier separates the data points into their respective class groups with a one-dimensional line. Usually decision planes are complex structure that makes optimal classification of set of objects. Hyperplane classifiers are used for the classification task of different class objects, where multiples lines would be required for optimal classification.
Support Vector Machines are required to perform such classification. In SVM, the original data points are transformed using kernel functions; such that the resulting class of data set can be classified using a linear classifier instead of a complex curve. Support Vector Machine (SVM) is primarily a classier method that performs classification tasks by constructing hyperplanes in a multidimensional space that separates cases of different class labels. SVM supports both regression and classification tasks and can handle multiple continuous and categorical variables.
What are various Data Types?
Data Type is a classification for identifying types of data that determines the value of that type, that operations that can be performed on the that type, the meaning of that data and the kind of values that can be stored in that type.
Below mentioned are the primary data types that are being used by majority of programming languages:
1. Integers
2. Boolean
3. Characters
4. Floating-point number
5. Alphanumeric Strings
How to GeoCode coordinates of a location using Data Science toolbox?
The Data Science toolkit allows the user to GeoCode unlimited number of geo-coordinates. Statistical software R offers a package that can be used as a wrapper for its functions (CRAN:RDSTK). "street2coordinates()" function from this package can be used to interface with Data Science Toolkit's geocoding application.
library(rjson)
library(httr)
data <- paste0("[",paste(paste0("\"",dff$address,"\""),collapse=","),"]")
url  <- "http://www.datasciencetoolkit.org/street2coordinates"
response <- POST(url,body=data)
json     <- fromJSON(content(response,type="text"))
geocode  <- do.call(rbind,sapply(json,
                                 function(x) c(long=x$longitude,lat=x$latitude)))

geocode

#                                    long       lat

# Sample City Name, State, Country   Sample    Sample
How to do Back-Propagation in a Neural Network using Python?
Back-propagation is the most common algorithm used to train feed-forward neural networks. In the method of back-propagation, we take the magnitude of the target output values and the neural network computed output values and calculate their error difference. Using this error difference value, the weights and bias of neural network nodes is adjusted such that the computed values are much closer to the target values. This process of back-propagation is repeated for a set number of iteration or until the error difference is less than required threshold.
Pseudo Code for Back-propagation:
Input: InputPatterns, Problem Size, LearnRate, MaxIterations
Output: Network
ConstructNetworkLayers()----Network
Initializeweights(Network, ProblemSize)----NetworkWeights
For(i = 1 to MaxIterations)
SelectInputPatter(InputPatterns)----Pattern-i
ForwardPropagate(Network, Patter-i)
BackwardPropagateErro(Output-i, Pattern-i, Network)
UpdateWeights(Output-i, Pattern-i, LearnRatee, Network)
End
Return(Network)
What is the meaning of correlation coefficient and what does it represent?
Correlation coefficient is a measure to calculate the degree of linear independence between two random variables. The most widely calculated correlation coefficient is the product moment correlation.
The correlation can have a value ranging between -1 to 1. If the value of correlation coefficient is zero, it implies that there is no linear relation between the input and output random variables. However, there could still be a non-linear relation. A positive coefficient means that the two random variables are directly proportional to each other, whereas a negative correlation coefficient implies that the variables are inversely proportional.
Which programming language is better for Natural Language Processing, Python or Java?
Both the languages offer good quality of resources, libraries, packages and toolkit when it comes to Natural Language Processing and Machine Learning. The choice of Python and Java has to be made depending upon the desired output. This answer will present a comprehensive comparison of both the programming language in terms of NLP.
Stanford's Natural Language Processing Group is the ideal resources for Java based NLP. The distributed software in that group is written in Java and they require Open JDK 7+ or Oracle Java 6+. Distributed package available from that group contains source code, Java API, jar files and command-line invocation. In addition to this Java offer Weka as an advanced Machine Learning environment. Weka contains tools for data classification, pre-processing, clustering, regression, visualization and association rues.
Python Natural Language Toolkit is the primary resource for Python based NLP applications. It considered as a leading platform to develop applications that interact with human language data. It also has optional GUI and text processing libraries for tokenizatoin, classification, tagging, stemming, semantic reasoning and parsing.
How to check if a sample text contains a particular sub string?
Python offers a quick way to check whether a sub string is part of a general text data, even in the case where the sub string may not necessarily be a perfect match. This problem can be solved by calculating Levenshtein Distance between two strings.
Levenshtein Distance equals to count of one-character edit(replace, remove or add) that is required on a string to convert it to another. There are various implementation to calculate the difference in length, one of them using pypi is mentioned below:
match = levenshtein_distance(string1, string2) <= abs(len(string1)-len(string2)+ LOOSE_COEFF)
LOOSE_COEFF is the variable which decides the accuracy of the match.
What is the difference between NumPy and SciPy?
Initially NumPy was created to contain basic operations and data types like sorting, indexing, reshaping, etc and ideally all the numerical code and functionalities would be contained in SciPy.
Since NumPy offers extended compatibility and support, therefore it contains all the features offered by its predecessors; therefore NumPy ended up containing functions of linear algebra and others, even though they ideally belong to SciPy. SciPy on the other hand contains complete linear algebra modules along with other numerical algorithms. Practically many functions in NumPy can be easily replicated in SciPy by using the respective namespace.
How to plot a histogram using Matplotlib?
Consider a dataset in histogram format, with center of the bins and the number of events per bin. This dataset can be used to plot a histogram plot in the following way:
import matplotlib.pyplot as plt
import numpy as np

mu, sigma = 10, 1
x = mu + sigma * np.random.randn(100000)
hist, bins = np.histogram(x, bins=50)
width = 0.7 * (bins[1] - bins[0])
center = (bins[:-1] + bins[1:]) / 2
plt.bar(center, hist, align='center', width=width)
plt.show()
Explain Naive Bayes Classification in simple terms.
Naive Bayes Classification is a machine learning algorithm which is used to classify data points based on their conditional probabilities. The concept of conditional probability and Bayes rules are essential to this algorithm. Conditional probability P(A|B) is the probability of occurrence of event A, given that event B has already happened.
Bayes rule of probability states: P(B|A) = [P(A|B)*P(B)]/P(A)
The above mentioned rule is used as Naive Bayes algorithm to determine the probability of an object to be classified in a certain category. Since Naive Bayes is used to classify, each outcome is stated as 'class' and a 'class-label' is associated with it. Through Naive Bayes, we calculate the conditional probability (or likelihood) of data point to be in this class.
What are some open source library for Neural Network in Python?
There are various open source libraries available for Neural Network implementation in Python. Some of them are mentioned below:
- PyBrain
- PyLearn 2
- Theanets
- Lasagne
- Keras
- Scikit-neuralnetwork
- Hebel
- Cuda-convnet
How do Random Forest Works?
Random forests are a combination of tree predictors such that each tree depends on the values of a random vector sampled independently and with the same distribution or all trees in the forest. The generalization error for forests converges as to a limit as the number of trees in the forest becomes large. The generalization error of a forest of tree classifiers depends on the strength of the individual trees in the forest and the correlation between them.
What are the different data structures available in Python programming language?
If you are new to the world of programming and wondering what data structures are then here is a simple definition that will help you understand the term Data Structure
"Data Structures are specialized format that can hold a collection of related data together."
Python has 5 important data structures namely –List, Tuple, Strings, Dictionary and Set that are extensively used by data scientists and data analysts for python data analysis.
How will you create and access a list data structure in Python?
Creating a Python List Data Structure
ProjectPro_DataScience_List = [1, 20, 3, 40, 5, 60]
Accessing the elements of a Python list data structure?
To access the first element of the list data structure use the below line of python code –
ProjectPro_DataScience_List [0];
Output on executing the above line will return the first element from the list i.e. 1.
There are several methods that can be applied to a list data structure in Python append (), sort (), reverse (), extend (), insert (), remove (), pop ().
DataScience_List = [1, 20, 3, 40, 5, 60]; What will be the output on executing the statement – print (“Trying to Access Elements using Negative Index : DataScience_List[-2])
The output for the above code will return 60 because negative index accesses the list from the end. Similarly, if you try to access DataScience_List [-2], it will display the second last element from the list.
What is a Python Tuple Data Structure?
Tuples are similar to list data structures that hold multiple objects but are immutable unlike lists. Tuples are generally used when a UDF or a statement assumes that the collection of values in the tuple will not change. As tuples are immutable(one cannot add, delete or edit any value inside the tuple) they consume less memory and are faster at data processing when compared to list data structures. Tuples are immutable but they can hold data that is mutable. Tuples are created by separating the item values through a comma and an optional parenthesis at the start and end of a tuple. Parenthesis are optional when creating a tuple but it is always good to use parenthesis to define the start and end of a tuple to ensure that nested tuples are processed correctly.
What will be the output of the following code- ProjectPro_DataScience_List = [1, 20, 3, 40, 5, 60]; ProjectPro_DataScience_List.append ([“45”,”55”]);?
On executing the above python list append function both the values will be appended at the end of the list as a single element only. When using append for python lists, regardless of whether you have a single element or multiple elements- it will be added as a single element. To confirm this you can just try to print the length of the ProjectPro_DataScience_List after executing the python list append function as shown above.
Print (“Number of Elements in the List is: len (ProjectPro_DataScience_List));
Output:
Number of Elements in the List is: 7
How will you create a Tuple data structure in Python?
A simple tuple data structure in Python can be created as shown below -
ProjectPro_DataScience_Tuple = (“Hadoop”,”Spark”, “Python”,”R Programming”, “NoSQL”)
You can create an empty tuple data structure in Python using empty parenthesis as shown below –
Sample_tup= ();
Even if there is a single value for the tuple, comma should be included after the value. A tuple in Python with a single value can be created as shown below –
Sample_Tup= (“ProjectPro”,);
What is an index in pandas dataframe?
Index in pandas dataframe is used to iterate through the data present in the dataframe.Pandas dataframe has a default index of 0. Suppose you have a file named "Sample.csv" containing the following data-
0 CourseName Cost
1 Hadoop 399
2 DataScience 699
3 Spark 399
Example Demonstrating the Use of Index in Pandas.Dataframe
df2 = pd.read_csv("Sample.csv") #This step will read the CSV file into the Pandas Dataframe.
for i in df2.index:
print df2.CourseName.ix[i]
print df2.Cost.ix[i]
Output :
Hadoop
399
DataScience
699
Spark
399
Load More
-
![Difference between Pig and Hive-The Two Key Components of Hadoop Ecosystem]() Difference between Pig and Hive-The Two Key Components of Hadoop Ecosystem
Difference between Pig and Hive-The Two Key Components of Hadoop Ecosystem -
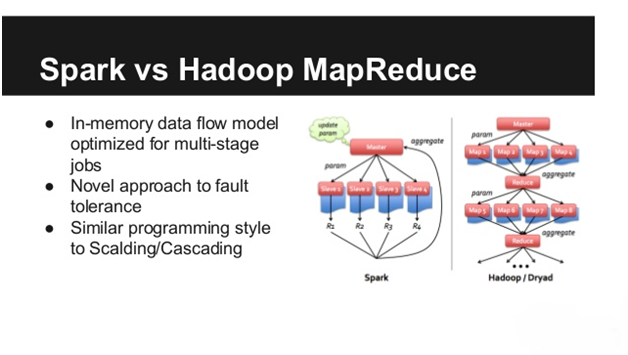
![Hadoop MapReduce vs. Apache Spark Who Wins the Battle?]() Hadoop MapReduce vs. Apache Spark Who Wins the Battle?
Hadoop MapReduce vs. Apache Spark Who Wins the Battle? -
![Top 50 Hadoop Interview Questions]() Top 50 Hadoop Interview Questions
Top 50 Hadoop Interview Questions -
![5 Job Roles Available for Hadoopers]() 5 Job Roles Available for Hadoopers
5 Job Roles Available for Hadoopers -
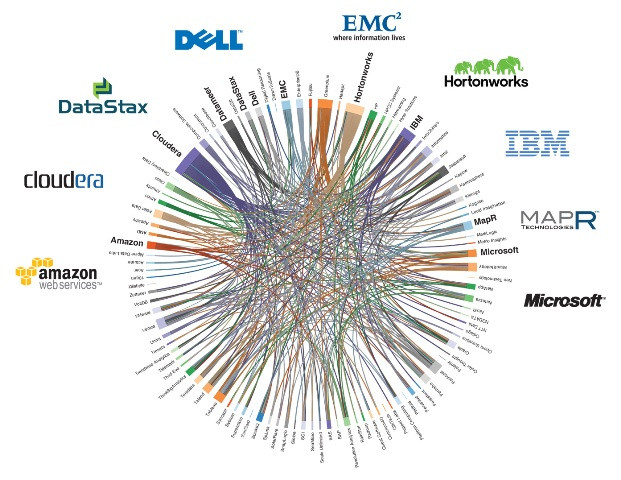
![Top 6 Hadoop Vendors providing Big Data Solutions in Open Data Platform]() Top 6 Hadoop Vendors providing Big Data Solutions in Open Data Platform
Top 6 Hadoop Vendors providing Big Data Solutions in Open Data Platform -
![Big Data Analytics- The New Player in ICC World Cup Cricket 2015]() Big Data Analytics- The New Player in ICC World Cup Cricket 2015
Big Data Analytics- The New Player in ICC World Cup Cricket 2015 -
![5 Reasons why Java professionals should learn Hadoop]() 5 Reasons why Java professionals should learn Hadoop
5 Reasons why Java professionals should learn Hadoop