


Big Data Engineer, Beyond Limits

Dev Advocate, Pinecone and Freelance ML

Data Science, Yelp

Head of Data Science, Slated
Use Spark , Grafana, and InfluxDB to build a real-time e-commerce users analytics dashboard by consuming different events such as user clicks, orders, demographics
Get started today
Request for free demo with us.
Schedule 60-minute live interactive 1-to-1 video sessions with experts.
Unlimited number of sessions with no extra charges. Yes, unlimited!
Give us 72 hours prior notice with a problem statement so we can match you to the right expert.
Schedule recurring sessions, once a week or bi-weekly, or monthly.
If you find a favorite expert, schedule all future sessions with them.
Source: ![]()
Source: ![]()
Source: ![]()
Source: ![]()
Source: ![]()
Source: ![]()
Source: ![]()
Source: ![]()
Source: ![]()
Source: ![]()
Source: ![]()
Source: ![]()
Source: ![]()
250+ end-to-end project solutions
Each project solves a real business problem from start to finish. These projects cover the domains of Data Science, Machine Learning, Data Engineering, Big Data and Cloud.
15 new projects added every month
New projects every month to help you stay updated in the latest tools and tactics.
500,000 lines of code
Each project comes with verified and tested solutions including code, queries, configuration files, and scripts. Download and reuse them.
600+ hours of videos
Each project solves a real business problem from start to finish. These projects cover the domains of Data Science, Machine Learning, Data Engineering, Big Data and Cloud.
Cloud Lab Workspace
New projects every month to help you stay updated in the latest tools and tactics.
Unlimited 1:1 sessions
Each project comes with verified and tested solutions including code, queries, configuration files, and scripts. Download and reuse them.
Technical Support
Chat with our technical experts to solve any issues you face while building your projects.
7 Days risk-free trial
We offer an unconditional 7-day money-back guarantee. Use the product for 7 days and if you don't like it we will make a 100% full refund. No terms or conditions.
Payment Options
0% interest monthly payment schemes available for all countries.
I am the Director of Data Analytics with over 10+ years of IT experience. I have a background in SQL, Python, and Big Data working with Accenture, IBM, and Infosys. I am looking to enhance my skills in Data Engineering/Science and hoping to find real-world projects fortunately, I came across Project Pro. Project Pro helped me by providing an in-depth explanation of the end-to-end real-world data engineering projects. From data extraction, transformation, and storage up to data visualization. I learned more about Kafka, AWS, NI-FI, and Spark. Thru the help of the knowledge I gained from Project Pro, I was able to do well in the coding exams, interview and helped me land a job at EY. I will recommend every aspiring data professional as well as existing data science/engineer expert to try Project Pro to enhance their knowledge.
Ed Godalle
Director Data Analytics at EY / EY Tech
I come from a background in Marketing and Analytics and when I developed an interest in Machine Learning algorithms, I did multiple in-class courses from reputed institutions though I got good theoretical knowledge, the practical approach, real word application, and deployment knowledge were missing. ProjectPro helped me bridge that gap. ProjectPro has real-time projects that helped me improve my skills. What I liked most is that I get exposure to so many projects, given the work nature I wouldn't have gotten exposure to such a variety of projects and their approaches. It is helping me apply knowledge to other projects too. I highly recommend ProjectPro to everyone who wants to excel in their DataScience career.
Ameeruddin Mohammed
ETL (Abintio) developer at IBM
As a student looking to break into the field of data engineering and data science, one can get really confused as to which path to take. Very few ways to do it are Google, YouTube, etc. I was one of them too, and that's when I came across ProjectPro while watching one of the SQL videos on the E-Learning Bridge YouTube channel. One of the standout features was that it featured real projects on topics I just read about, across different job descriptions at the time. The main issue was the right path to guide us in using these tools and adding to the resume, and that's exactly what ProjectPro got me through. The fact that I can have a reliable route and videos explaining each tool in detail really motivated me to continue with the platform. Another thing we all struggle with is how to really connect with someone if we're stuck somewhere because there are so many solutions. But this has also been solved by experts we can chat with and believe me when I say this they will do whatever it takes to solve your problem even if it takes longer than expected. In my sophomore year of college and getting hands-on exposure to technologies like PySpark, NLP, Kafka, etc, and being able to really apply the theory and work on a project from start to finish really boosted my confidence in general!
Savvy Sahai
Data Science Intern, Capgemini
ProjectPro is a unique platform and helps many people in the industry to solve real-life problems with a step-by-step walkthrough of projects. A platform with some fantastic resources to gain hands-on experience and prepare for job interviews. I would highly recommend this platform to anyone looking to upskill and stay updated with the latest projects and solutions. Overall this platform is awesome and worth the money spent as we get a lot of value out of it and helps soar our career to greater heights.
Anand Kumpatla
Sr Data Scientist @ Doubleslash Software Solutions Pvt Ltd
Big Data Engineer, Beyond Limits
Dev Advocate, Pinecone and Freelance ML
Data Science, Yelp
Head of Data Science, Slated
Machine Learning Manager, Adobe
Data Engineer - Capacity Supply Chain and Provisioning, Microsoft India CoE
Data Science Consultant, Fractal Analytics
Global Data Community Lead | Lead Data Scientist, Thoughtworks
Principal Data Scientist - Cyber Security Risk Management, Verizon
Director of Data Science & AnalyticsDirector, ZipRecruiter
Senior Applied Scientist, Amazon
Senior Data Scientist, Mawdoo3 Ltd
University of Economics and Technology, Instructor
Senior Data Platform Engineer, GoodRx
Data Engineering Manager, Microsoft Corporation
Big Data & Analytics architect, Amazon
Data Scientist, Inmobi
Data Scientist, Boeing
Senior Data Engineer, Publicis Sapient
Chief Scientific Officer, Machine Medicine Technologies
Principal Software Engineer, Afiniti
Data Engineering Lead - Uber
Senior Data Engineer, Hogan Assessment Systems
NLP Engineer, Speechkit
Chief Science Officer at DataPrime, Inc.
Data Engineer, Microsoft
Data Scientist, SwissRe
Senior Data Engineer, National Bank of Belgium
Director of Business Intelligence , CouponFollow
Head of Data science, OutFund
Data Scientist, Credit Suisse
Senior Data Engineer, Slintel-6sense company
Data and Blockchain Professional
Real-time dashboards have become indispensable for companies like MAANG (Microsoft, Amazon, Apple, Netflix, Google), industry leaders in today's fast-paced business ecosystem. The primary business objective of implementing a real-time dashboard with Spark, Grafana, and InfluxDB is to enhance operational efficiency significantly. Drawing inspiration from the practices of MAANG companies, this project aims to support businesses in making informed, timely decisions using Spark Grafana and Influx DB by providing instantaneous insights into key performance indicators.

In this project, we will build a real-time e-commerce user analytics Dashboard. By consuming different events, such as user clicks, orders, and demographics, we create a dashboard that gives a holistic view of insights, such as how a campaign performs country-level, gender-based order count, and real-time purchase insights.
By adopting cross-functional collaboration, the dashboard acts as a central hub, breaking down complexities and ensuring a unified source of truth for diverse teams. This project introduces a powerful technological stack as businesses strive for agility and data-driven decision-making. It encourages readers to explore the transformative impact of real-time dashboards, enabling them to embrace the future of operational excellence.
The batch data consists of 100,000 auto-generated user demographic data points, including the following features:
Id, Age, Gender, State, Country
The stream data is based on user purchase events and is produced every 1 second with a timestamp when combined with batch data. This data includes the following features:
Id, campaignID, orderID, total_amount, units, tags- click/purchased.
➔ Language: Java8, SQL
➔ Services: Kafka, Spark Streaming, MySQL, InfluxDB, Grafana, Docker, Maven
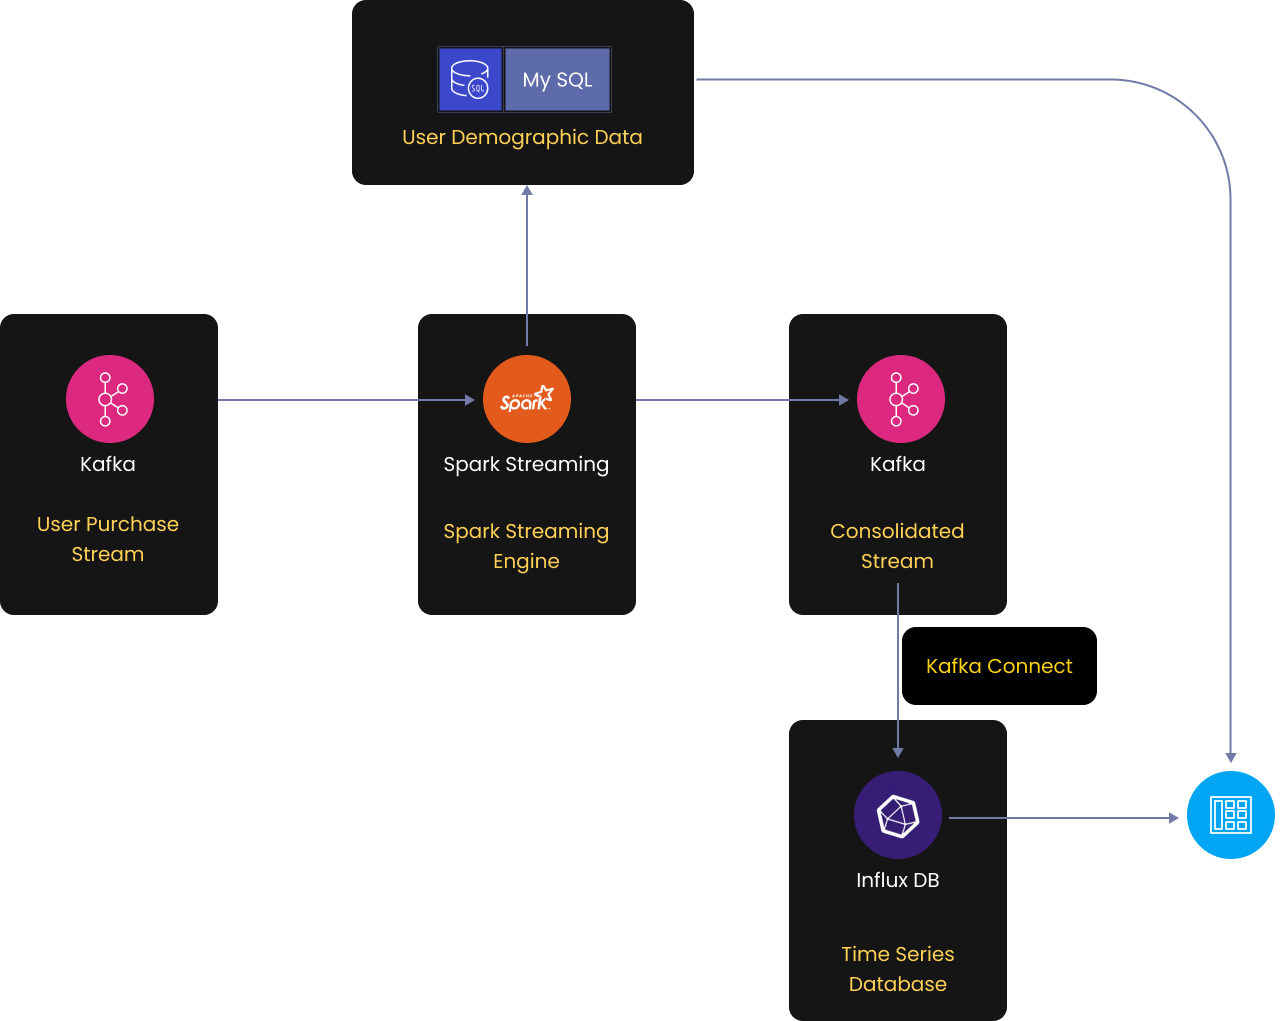
User purchase events in Avro format are produced via Kafka.
Spark Streaming Framework does join operations on batch and real-time events of user purchase and demographic type.
MySql Holds the demographic data such as age, gender, country, etc.
Spark Streaming Framework consumes these events and generates various points suitable for time series and dashboarding.
Kafka connect pushes the events from the Kafka streams to influxDB.
Grafana connects to different sources like influxDB and MySQL and populates the graphs.
This end-to-end project provides a comprehensive solution for analyzing and visualizing user purchase and demographic data in real time. You will understand the use of different tools in this project and the need to choose their respective versions.
We'll cover Spark's architecture and its vital role in various aspects of this project solution. You'll learn to set up Spark sessions, an essential but important step in making Spark work for us. We'll use Spark to handle real-time and batch data smoothly, mixing actions and transformations. And as we go along, you'll see why Spark is great for efficiently handling significant amounts of data. It's the engine that helps us build a robust and scalable analytics solution for creating real-time dashboards.
Kafka is a distributed data storage designed for real-time data intake and processing. Streaming data is created continuously by hundreds of data sources transmitting data records simultaneously. A streaming platform must cope with the continual input of data and process it sequentially and gradually. Kafka mainly creates real-time streaming data pipelines and applications that react to data streams. It mixes communications, storage, and stream processing to allow historical and real-time data to be stored and analyzed.
In this project, Kafka is pivotal in managing stream and batch data components. You'll craft a user-producer event in Avro format using Java and Kafka libraries, ensuring a robust data-sourcing pipeline. Additionally, you'll establish a connection between Kafka and InfluxDB by creating a connector instance in Kafka Control Centre and delving into the connector's JSON file to configure it to accept Kafka topics. You'll validate the correctness of the pipeline of a seamless connection in the InfluxDB Docker container by running SQL queries. This comprehensive approach ensures a seamless and reliable integration of Kafka in the project workflow.
Spark Streaming is a Spark API service that enables data engineers and scientists to handle real-time data from various sources, including Kafka, Flume, Amazon Kinesis, etc. Once analyzed, data may be delivered to file systems, databases, and live dashboards. With Spark Streaming, this Spark Grafana project combines two real-time data types from different sources. It helps us quickly combine batch and streaming events, mixing user purchase and demographic data from MySQL. Spark Streaming then adjusts the data for time series analysis and making dashboards. It's like a helpful tool that organizes everything smoothly, preparing our data for quick study and showing on the dashboards.
MySQL is a SQL (Structured Query Language) based relational database management system. Data warehousing, e-commerce, and logging applications are a few of the platform's uses. In the Apache Spark Dashboard project, MySQL is a storage space where we organize our data. We collect information from real-time streaming; tables are updated every 12 to 24 hours. We capture this data using a Spark batch job and neatly store it in MySQL.
InfluxData developed InfluxDB, an open-source time-series database. It's created in Go and designed to store and retrieve time series data quickly and reliably in domains including operations monitoring, application metrics, Internet of Things sensor data, and real-time analytics. In this Spark Grafana project, InfluxDB serves as a specialized database for storing and managing time-series data. The streaming events, sourced using Java and Kafka, are connected to InfluxDB through a connector instance in Confluent. This connection ensures that the real-time data is efficiently stored and organized in InfluxDB. The integration of InfluxDB is crucial for creating a seamless pipeline that allows for quick access and analysis of time-series data. Additionally, the project involves running SQL queries on InfluxDB to validate the data and ensure its accuracy.
Grafana is an open-source and cross-platform web application for interactive visualization and analytics. When linked to supported data sources, it displays charts, graphs, and alerts on the web for mainly time series data. Grafana is the central visualization tool, connecting multiple sources, including InfluxDB and MySQL, dynamically populating graph. During this project, participants will gain hands-on experience using Grafana to perform analytics on the integrated data. They will learn how to connect data sources within Grafana, seamlessly integrating information from InfluxDB and MySQL. The project solution will cover creating panels for analytics, demonstrating how to select various variables, and plot insightful graphs. Participants will discover the art of configuring Grafana dashboards, allowing them to interpret and analyze the integrated data visually.
Thus, the project guides users in building a real-time analytics pipeline using Spark, Kafka, InfluxDB, and MySQL. The goal is to teach them to integrate diverse data sources, perform real-time joins, and leverage Grafana to create insightful dashboards.
Grafana dashboard is used for visualizing and analyzing time-series data, allowing users to create interactive and customizable dashboards to monitor various metrics and performance indicators in real-time.
Grafana dashboards can be connected to various databases, but commonly used ones include InfluxDB, Prometheus, Graphite, Elasticsearch, and more, depending on the specific data source requirements.
To host a Grafana dashboard, you can deploy it on a server or use cloud services like AWS, Azure, or Google Cloud. Installation involves configuring the server environment, setting up dependencies, and connecting to the desired data sources.
Deploying a Grafana dashboard involves:
Creating and configuring dashboards within the Grafana interface.
Connecting to data sources.
Deploying the configured dashboards to the server or cloud environment where Grafana is hosted.
This approach ensures that users can access and interact with the visualized data.
Recommended
Projects
Data Science vs Data Engineering:Choosing Your Career Path
Data Science vs Data Engineering-Learn key differences, and career tips to seamlessly transition from data engineer to data scientist with ProjectPro
7 Retrieval Augmented Generation Project Ideas for Practice
Explore top 7 Retrieval Augmented Generation project ideas to enhance your AI skills with ProjectPro.
Chain of Thought Prompting in LLMs : A Beginner's Guide
Discover Chain of Thought Prompting – a way to have more interesting conversations with smart computers!
Get a free demo
ProjectPro
![]()
![]()
![]()


