Explain the usage of analytical functions in hive?
This recipe explains what the usage of analytical functions in hive
Recipe Objective
In big data scenarios , when data volume is huge, we may need to find a subset of data to speed up data analysis. Here comes a technique to select and analyze a subset of data in order to identify patterns and trends in the data known as sampling.
System requirements :
- Install ubuntu in the virtual machine click here
- Install single node hadoop machine click here
- Install apache hive click here
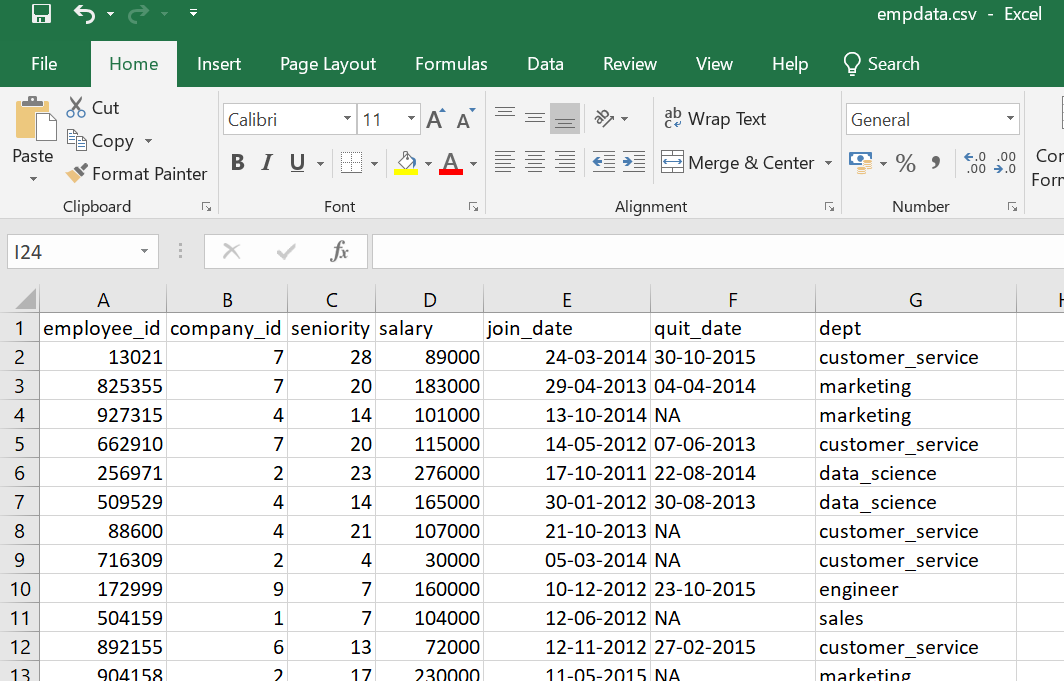
Step 1 : Prepare the dataset
Here we are using the employee related comma separated values (csv) dataset for the create hive table in local.
Data of Output looks as follows:
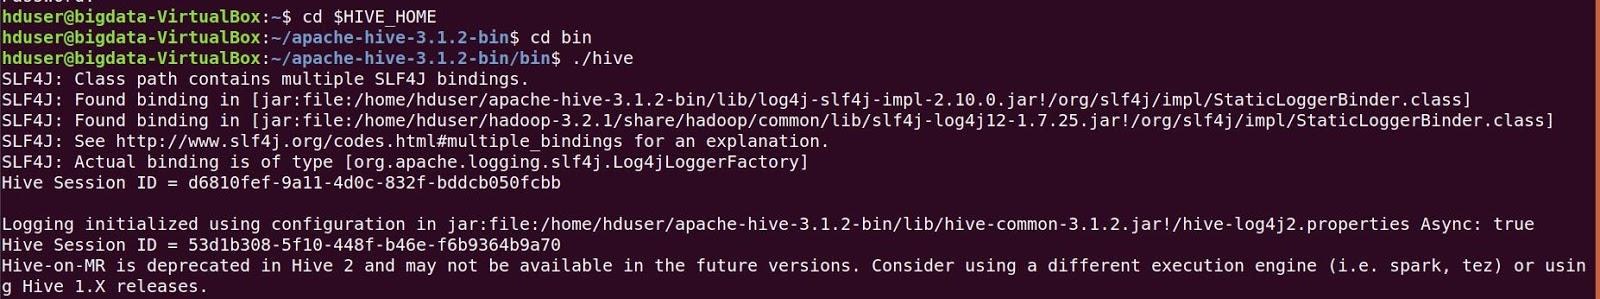
Before create a table open the hive shell and we need to create a database as follows :Open the hive shell as below
To create database using below queries :
Create database dezyre_db;
use dezyre_db;
As follows below:

Step 2 : Create a Hive Table and Load the Data into the Table and verify the Data
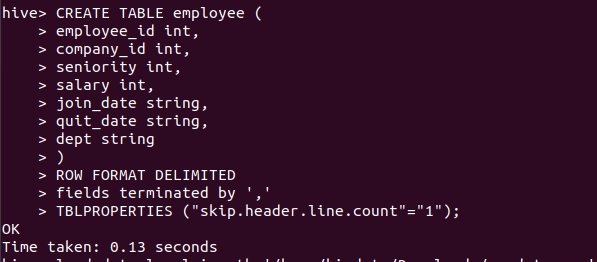
Here we are going create a hive table for loading the data from this table to created bucketed tables, Use below to create a hive table:
CREATE TABLE employee (
employee_id int,
company_id int,
seniority int,
salary int,
join_date string,
quit_date string,
dept string
)
ROW FORMAT DELIMITED
fields terminated by ','
TBLPROPERTIES ("skip.header.line.count"="1");
the above query runs as follows :
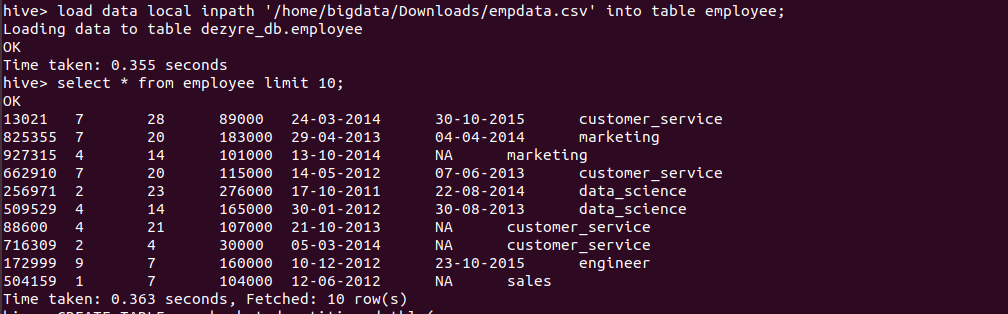
Loading the data into hive table and verifying the data
load data local inpath '/home/bigdata/Downloads/empdata.csv' into table employee;
Verifying the data by running the select query as follows
Step 3 : Explanation of Analytic functions in hive
Analytic functions are a special group of functions that scan the multiple input rows to compute each output value. Analytic functions are usually used with OVER, PARTITION BY, ORDER BY, and the windowing specification.The analytic functions offer greater flexibility and functionalities than the regular GROUP BY clause and make special aggregations in Hive easier and powerful.
The Analytic functions are :
- RANK
- DENSE_RANK
- ROW_NUMBER
- CUME_DIST
- PERCENT_RANK
- NTILE
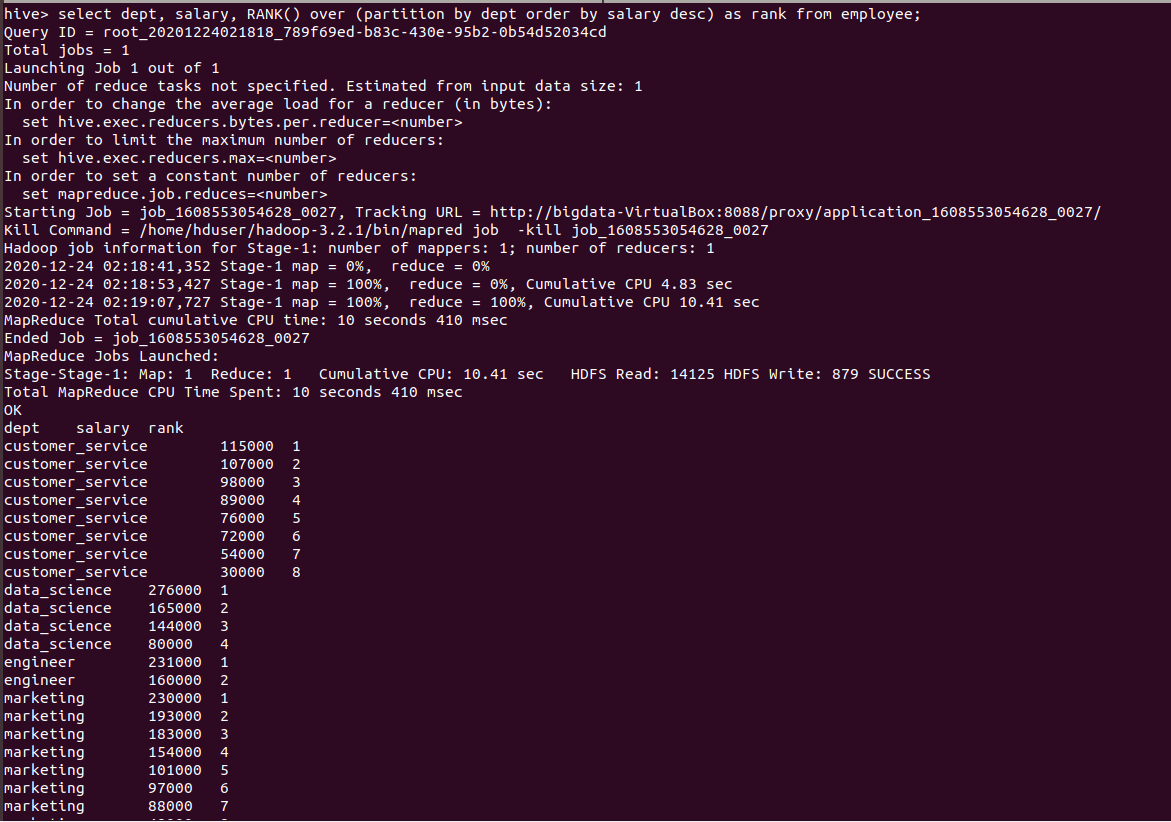
- RANK():
The rank function ranks items in a group, such as finding the top N rows for specific conditions. This function is used to assign a rank to the rows based on the column values in OVER clause. The row with equal values assigned the same rank with next rank value skipped.
hive>SELECT * FROM employee DISTRIBUTE BY RAND() SORT BY RAND()
LIMIT 10;
Output of the above query :
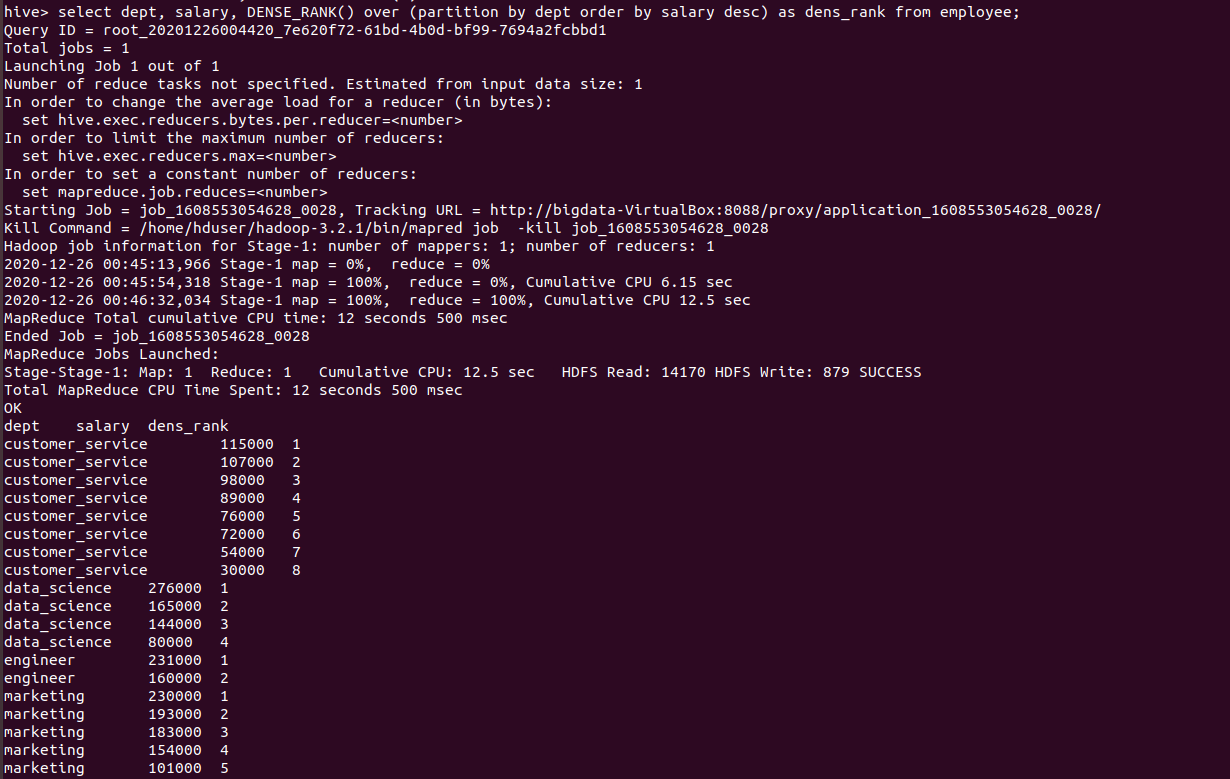
- DENSE_RANK():
It is similar to RANK, but leaves no gaps in the ranking sequence when there are ties. the rank assigns in the sequential order so that no rank values are skipped. DENSE_RANK() function returns consecutive rank values. Rows in each partition receive the same ranks if they have the same values.
hive> select dept, salary, DENSE_RANK() over (partition by dept order by salary desc) as dens_rank from employee;
the above query runs as follows
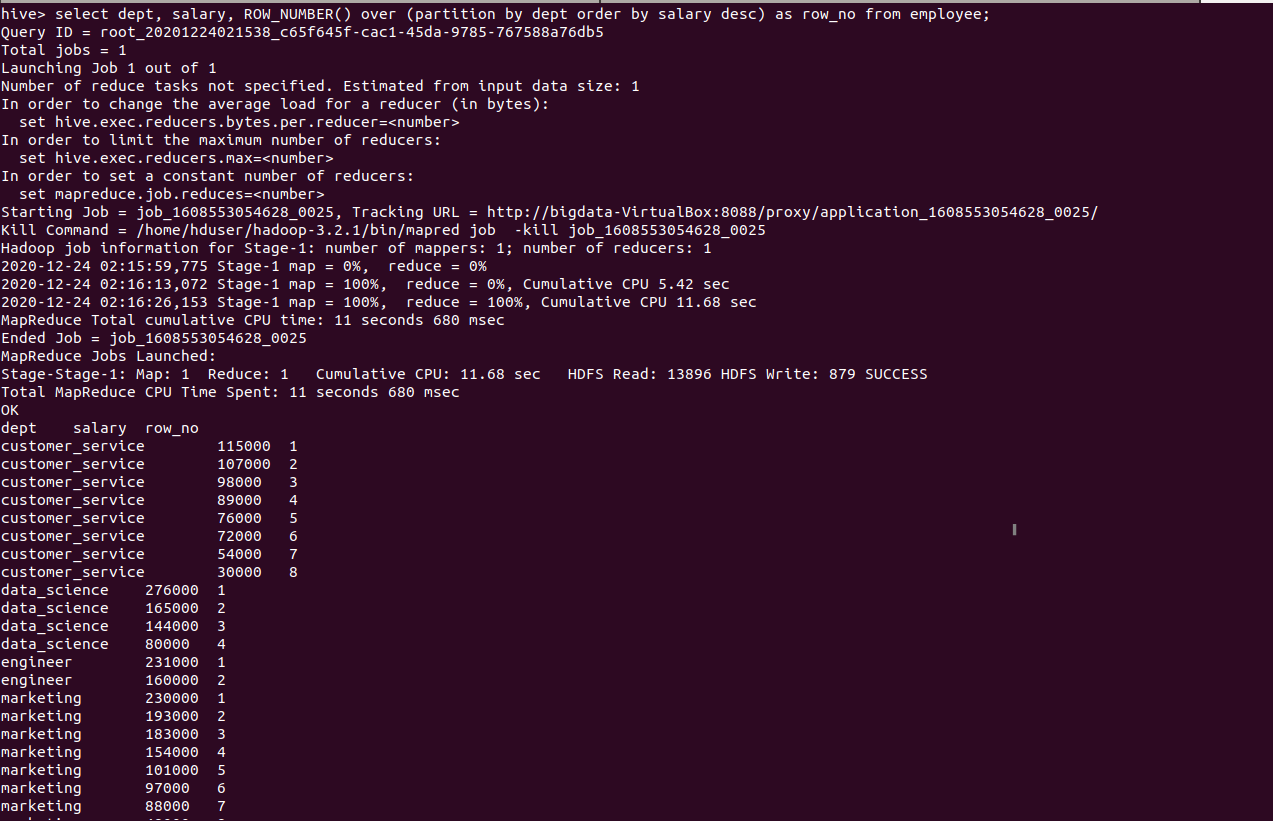
- ROW_NUMBER():
This function is used to assign a unique sequence number starting from 1 to each row according to the partition and order specification.
hive> select dept, salary, ROW_NUMBER() over (partition by dept order by salary desc) as row_no from employee;
Output of the above query as follows:
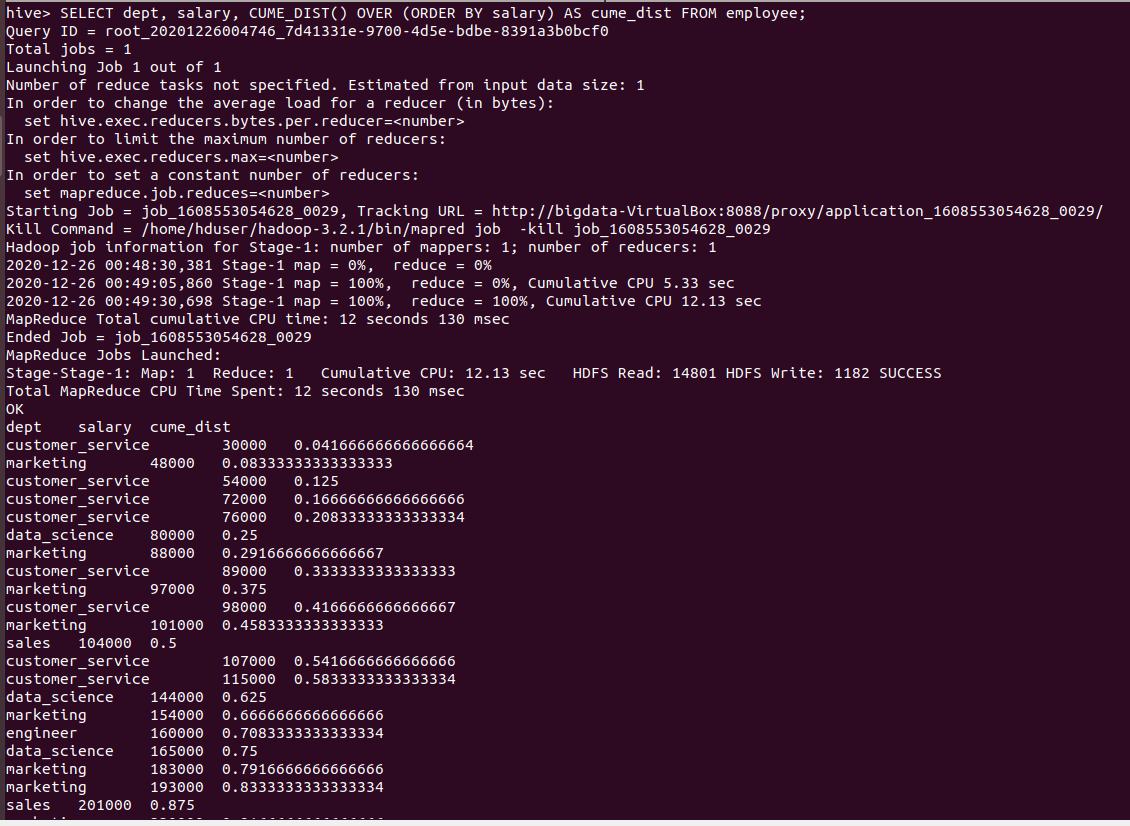
- CUME_DIST():
It computes the number of rows whose value is smaller or equal to the value of the total number of rows divided by the current row.it gives the values in the float data type.
hive> SELECT dept, salary, CUME_DIST() OVER (ORDER BY salary) AS cume_dist FROM employee;
Output of the above query :
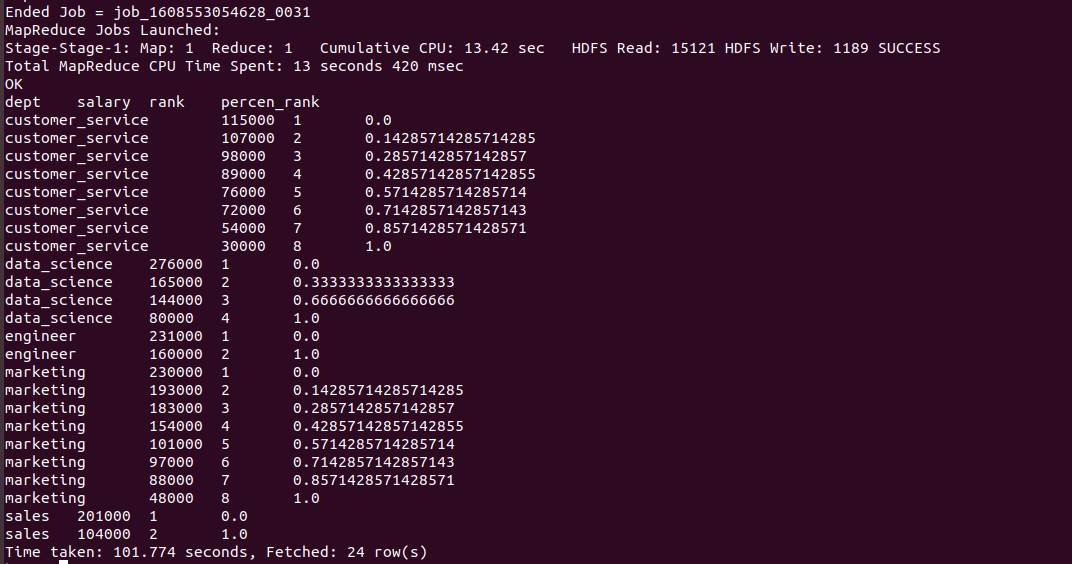
- PERCENT_RANK():
It is similar to CUME_DIST, but it uses rank values rather than row counts in its numerator as total number of rows - 1 divided by current rank - 1. Therefore, it returns the percent rank of a value relative to a group of values.
hive>SELECT dept, salary, RANK() OVER (PARTITION BY dept ORDER BY salary DESC) AS rank, PERCENT_RANK() OVER (PARTITION BY dept ORDER BY salary DESC) AS percen_rank FROM employee;
Output of the above query :
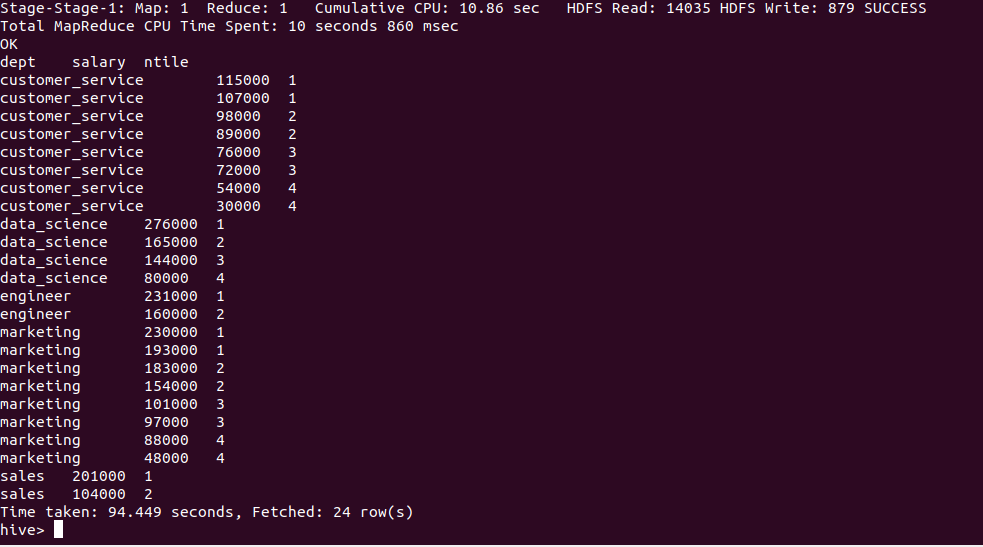
- NTILE():
It divides an ordered dataset into a number of buckets and assigns an appropriate bucket number to each row. It can be used to divide rows into equal sets and assign a number to each row.
hive > SELECT dept, salary, NTILE(4) OVER (PARTITION BY dept ORDER BY salary DESC) AS ntile FROM employee;
Output of the above query :
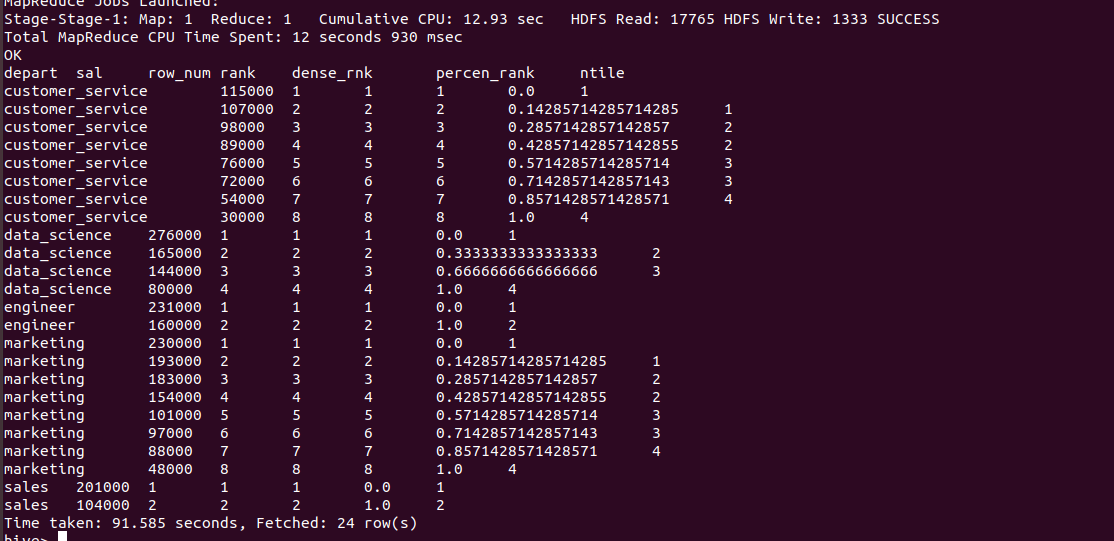
Performing as query All the analytical funcitons together as follows :
hive >SELECT dept AS depart, salary AS sal,
ROW_NUMBER() OVER (PARTITION BY dept ORDER BY salary DESC) AS row_num,
RANK() OVER (PARTITION BY dept ORDER BY salary DESC) AS rank,
DENSE_RANK() OVER(PARTITION BY dept ORDER BY salary DESC) AS dense_rnk,
PERCENT_RANK() OVER (PARTITION BY dept ORDER BY salary DESC) AS percen_rank,
NTILE(4) OVER (PARTITION BY dept ORDER BY salary DESC) AS ntile FROM employee ;
Output of the above query :

What Users are saying..

Savvy Sahai
As a student looking to break into the field of data engineering and data science, one can get really confused as to which path to take. Very few ways to do it are Google, YouTube, etc. I was one of... Read More