How to enter and read data in R
In this recipe, we will learn how to enter data manually in R as well as how to read all different types of data files in R.
How to enter and read data in R?
In this tutorial, you will learn –
• How to manually enter raw data in R?
• How to read data in RStudio?
• How to read data in R?
Reading an RData file in R
Reading RDS file in R
Reading data with delimited data in R
Reading Fixed-width-formats in R
Reading a text file in R
Reading a CSV file in R
Reading an excel file in R
Reading a JSON file in R
How to manually enter raw data in R?
You can make use of the given syntax to enter a single vector of numeric or character values in R.
var <- c (value1, value2, value3, …)
Let us create a vector with numeric values.
Code:
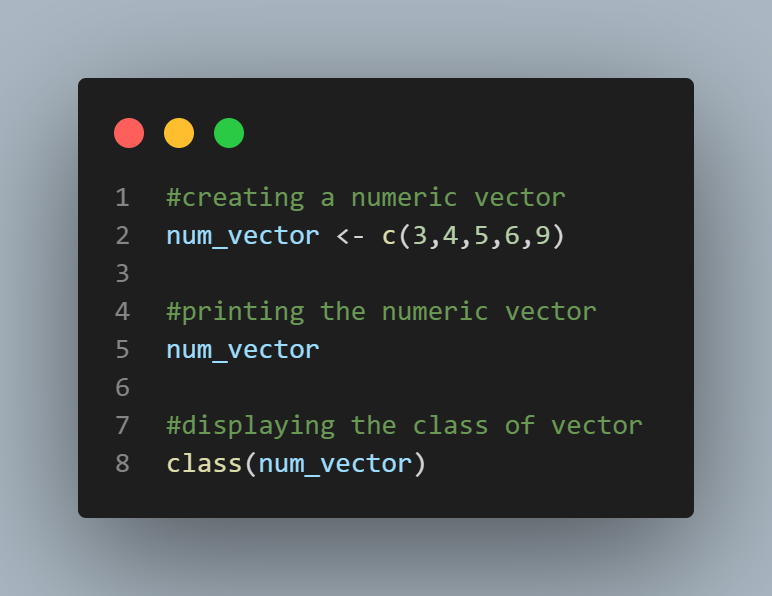
#creating a numeric vector
num_vector <- c(3,4,5,6,9)
#printing the numeric vector
num_vector
#displaying the class of vector
class(num_vector)
Output:
[1] 3 4 5 6 9
[1] "numeric"
Let us now create a vector with character values.
Code:

#creating a character vector

char_vector <- c('a','xyz','pqr','efg')


#printing the vector

char_vector


#displaying class of the vector

class(char_vector)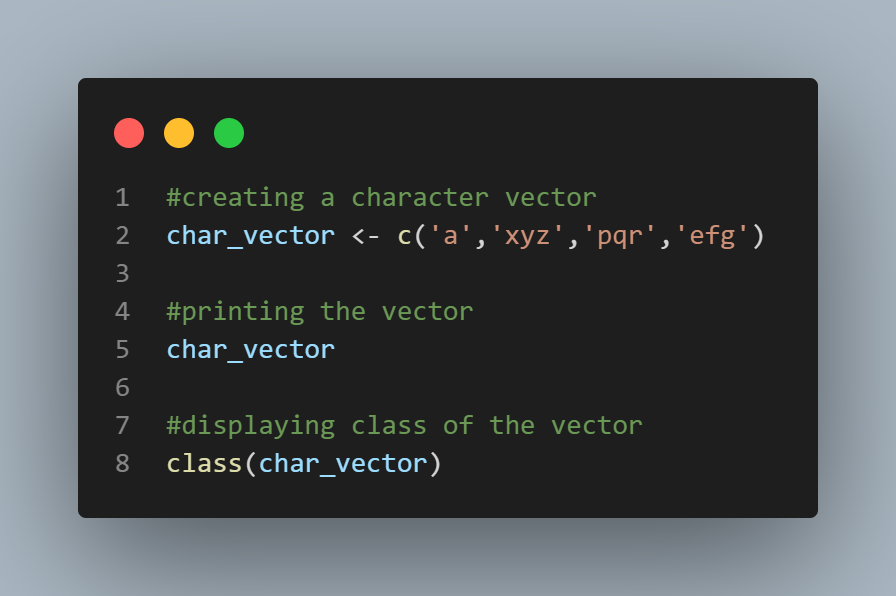
Output:
[1] "a"   "xyz" "pqr" "efg"
[1] "character"
You can also bind two vectors to form a matrix in R as follows –
Code:

#vector with numeric values 1

vec1 <- c(3,5,7,1)


#vector with numeric values 2

vec2 <- c(1,9,4,6)


#column bind the two vectors

mat <- cbind(vec1,vec2)


#printing the matrix

mat


#displaying class of matrix

class(mat)
Output:
     vec1 vec2
[1,]    3    1
[2,]    5    9
[3,]    7    4
[4,]    1    6
[1] "matrix"
Note that in a matrix each column has to be of the same data type.
You can also create your dataframe in R with the data.frame() function. Let us see an example –
Code:

df <- data.frame(player=c("Player1", "Player2", "Player3", "Player4"),

score=c(23,42,16,27),

result=c("L","W","L","W"))


#printing the dataframe

df


#displaying class of dataframe

class(df)
Output:
   player score result
1 Player1    23      L
2 Player2    42      W
3 Player3    16      L
4 Player4    27      W
[1] "data.frame"
How to read data in RStudio?
If you are a beginner and using RStudio then the easiest way to read data in R is by using the “Import Dataset” tab on the RStudio IDE as follows –
Click on the Import Dataset tab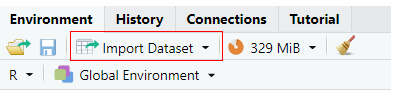
Next, based on the type of file you want to read choose the subsequent option. 
• If you want to import data from text files choose the “From Text (base)” option that allows importing text files using the base package.
• If you want to import a CSV file or any character delimited file you must choose the “From Text (readr)” option that allows you to do so using readr package.
• If you want to import an excel file, you can do so by choosing the “From Excel” option.
RStudio enables you to perform pre-processing operations such as – changing column data type, skipping columns, skipping first N rows, renaming the dataset, encoding selection, etc.
You can also import data from file systems or URLs directly.
How to read data in R?
Importing data is very simple in R as it can read data from most formats.
Now before we import the data it is very important to make sure that you set the R working directory the same as the location of the data. R even lets users choose their data file interactively with the help of the file.choose() function.
Example:

#reading data by choosing file interactively

df <- read.csv(file=file.choose()) 
Let us take a look at the functions that help us import data in R.
To read an R Data file – load()
When the load() function is used, R loads all of the R objects saved in the file.
Example:

#reading R data file

load("example.rdata")
To read an RDS file – readRDS()
A single R object can be restored using the readRDS() function.
Example:

#reading RDS file

dfRds <- readRDS("example.rds")
To read a delimited data file – read.table()
The parameters for read.table() function includes HEADER that can be set TRUE if the first row of the data holds variable names and Sep that indicates the delimiter used.
Example:

#reading space delimited data

dfSpace <- read.table("example.dat", header=TRUE, sep= " ")


#reading tab delimited data

dfTab <- read.table("example.dat", header=TRUE, sep= "\t") 
To read data using fixed-width-formats – read.fwf()
The parameters for read.fwf() function includes HEADER that can be set TRUE if the first row of the data holds variable names. The default value for the same is set FALSE.
Example:

#reading fixed-width-formats

dfFwf <- read.fwf("example.txt", header=TRUE)
To read a text file in R
https://www.projectpro.io/recipes/read-text-file-r
To read a CSV file in R
https://www.projectpro.io/recipes/read-csv-r
To read a JSON file in R
https://www.projectpro.io/recipes/read-json-r
To read data using dplyr package
https://www.projectpro.io/recipes/read-data-dplyr-package-r
To read an image data in R
https://www.projectpro.io/recipes/read-images-r

What Users are saying..

Ed Godalle
I am the Director of Data Analytics with over 10+ years of IT experience. I have a background in SQL, Python, and Big Data working with Accenture, IBM, and Infosys. I am looking to enhance my skills... Read More