How to make a boxplot and interpret it
In this recipe, we will learn what is a boxplot. We will learn how to make boxplots in python as well as R. We will also learn how to read a boxplot.
How to make a boxplot and interpret it?
In this tutorial, we will learn -
1) What are boxplots
2) How to plot a boxplot in python
a) Boxplot using pandas
b) Boxplot using matplotlib
c) Boxplot using seaborn
d) Boxplot using plotly
3) How to plot a boxplot in R
4) How to read a boxplot
Table of Contents
1) What are boxplots
A boxplot is a chart that shows how the values of a variable are distributed. It is also known as the Whisker plot and it gives you information about variability and dispersion of the data using a five-number summary. These include minimum, first quartile (Q1), median, third quartile (Q3), and maximum. Boxplots are often used for outlier detection.
Master the Art of Data Cleaning in Machine Learning
Some terms:
minimum - The least value in the dataset
first quartile - The first quartile or Q1 is the 25th percentile. It is the number between the smallest number and the median of the dataset.
median - The median or Q2 is the 50th percentile. It is the value that lies in the middle of the dataset.
third quartile - The third quartile or Q3 is the 75th percentile. It is the number between the largest number and the median of the dataset.
maximum - The highest value of the dataset
interquartile range - The interquartile range or IQR consists of data points between the 25th and 75th percentile. IQR = Q3 - Q1
lower fence - It is represented by the left/bottom whisker. It can be calculated as Q1-1.5*IQR
upper fence - It is represented by the right/top whisker. It can be calculated as Q3+1.5*IQR
outliers - The data points below the lower fence and above the maximum fence are referred to as outliers.
Note: The whiskers of a boxplot only go as far as the maximum/minimum pointless/greater than the upper/lower fence value.
For example, if Q3 + 1.5 * IQR = 10 and the dataset values are (..., 6,7,8,9,13), then the whisker will only go as far as 9, and 13 will be considered as an outlier. The whiskers will only extend to the fence values if there were observations (data points) equal to the fence values, otherwise, the whiskers extend to the most extreme observations that lie within the fences.
Let us consider a sample dataset as follows-
{5,7,10,15,19,21,22,23,24,25,70}
Here,
Median = Q2 = 21 (Middle value)
Q1 = 10 (Middle value between median and the smallest number)
Q3 = 24 (Middle value between median and the largest number)
IQR = Q3 - Q1 = 244- 10 = 14
lower fence = Q1 - 1.5 * IQR = 10 - 1.5 * 14 = -11
upper fence = Q3 + 1.5 * IQR = 24 + 1.5 * 14 = 45
Outliers (if datapoint < lower fence or datapoint > upper fence)- 70 > 45 i.e. 70 is an outlier.

2) How to plot a boxplot in Python
Python offers many libraries for visualizing data. Some of them include pandas, matplotlib, seaborn and plotly. We will see how to plot a boxplot using each of these libraries.
We will first create a dataset for plotting purposes.
Code:
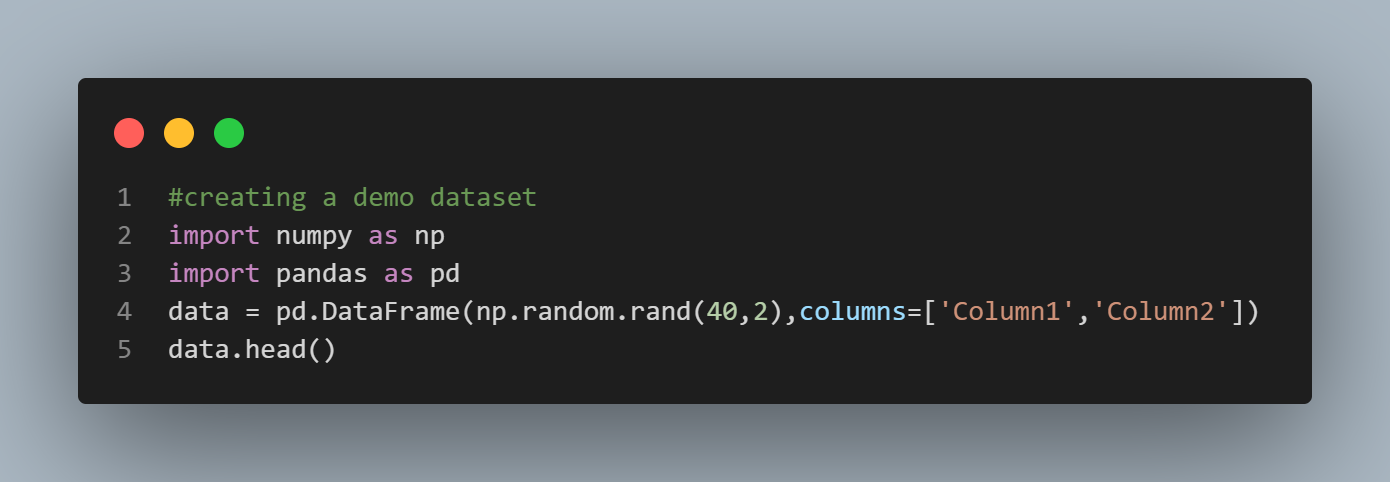
#creating a demo dataset
import numpy as np
import pandas as pd
data = pd.DataFrame(np.random.rand(40,2),columns=['Column1','Column2'])
data.head()
Output:
    Column1 Column2
0   0.016043    0.609038
1   0.303833    0.812328
2   0.945346    0.734032
3   0.105806    0.408104
4   0.509838    0.035799
Now that our sample dataset is ready, we can begin creating boxplots.
a) Boxplot using pandas
We have created a pandas data frame, so we can create a boxplot using the pandas library directly. The syntax is as simple as-
DataFrame.plot.box()
Code:

#simple boxplot using pandas

data.plot.box(title='Plotting boxplot using pandas')

Output:

b) Boxplot using matplotlib
matplotlib is a python library that is used for data visualization extensively. To plot a boxplot using matplotlib, the syntax is as simple as-
matplotlib.pyplot.boxplot(data, notch=None, vert=None, patch_artist=None, widths=None)
Let us plot our data
 Code:

#importing library

import matplotlib.pyplot as plt


#plotting a simple boxplot for Column1

plt.boxplot(data['Column1'])

plt.title("Boxplot using matplotlib")

Output:

Let us try another example-
Code:
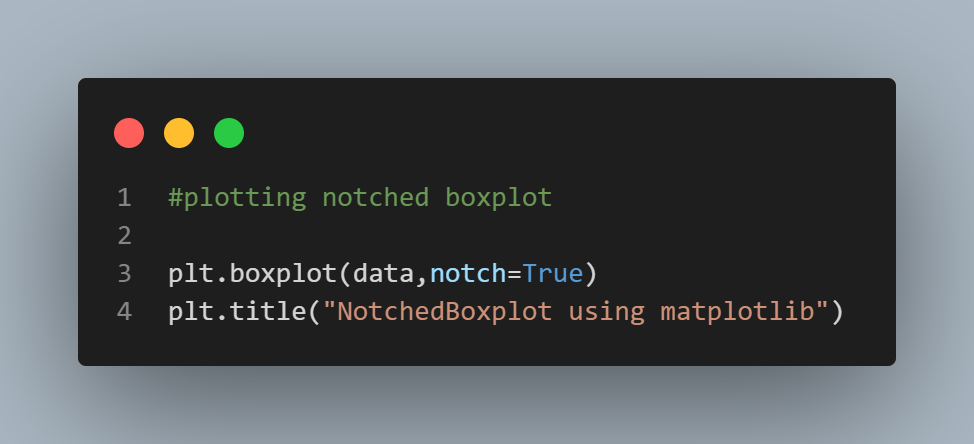
#plotting notched boxplot
plt.boxplot(data,notch=True)
plt.title("NotchedBoxplot using matplotlib")
Output:

c) Boxplot using seaborn
Seaborn is yet another python library used for statistically visualizing the data. The syntax to plot a boxplot using seaborn is as follows-
Syntax- seaborn.boxplot(x=None, y=None, hue=None, data=None, order=None, hue_order=None, orient=None, color=None, palette=None, saturation=0.75, width=0.8, dodge=True, fliersize=5, linewidth=None, whis=1.5, notch=False, ax=None, **kwargs)
Parameters:
x = dataset feature
y = dataset feature
hue = dataset feature
data = dataframet
color = matplotlib color
 Code:

#importing library

import seaborn as sns


#plotting simple boxplot

sns.boxplot(x="Column1",data=data)

Output:

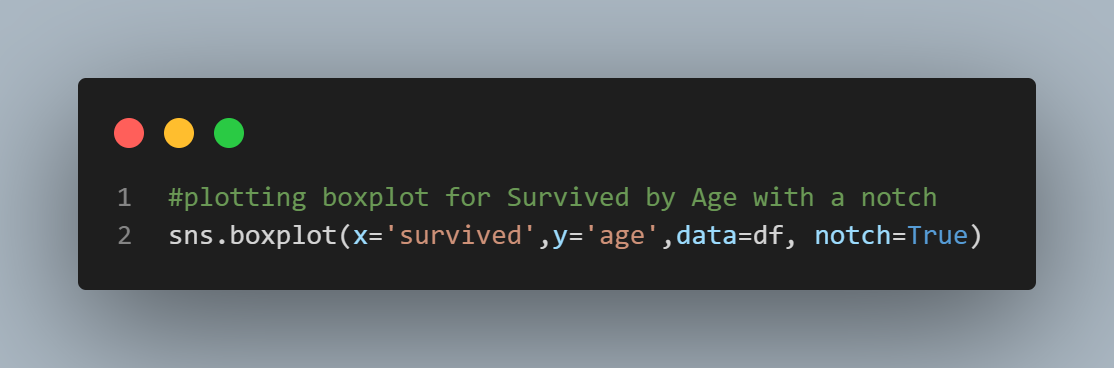
Seaborn has several built-in datasets. Let us make use of the "titanic" dataset. This dataset contains information about whether or not a person survived the Titanic's sinking, as well as other details about the person. Let us look at the distribution of survived based on the age of the passenger.
 Code:

#plotting boxplot for Survived by Age with a notch

sns.boxplot(x='survived',y='age',data=df, notch=True)
Output:

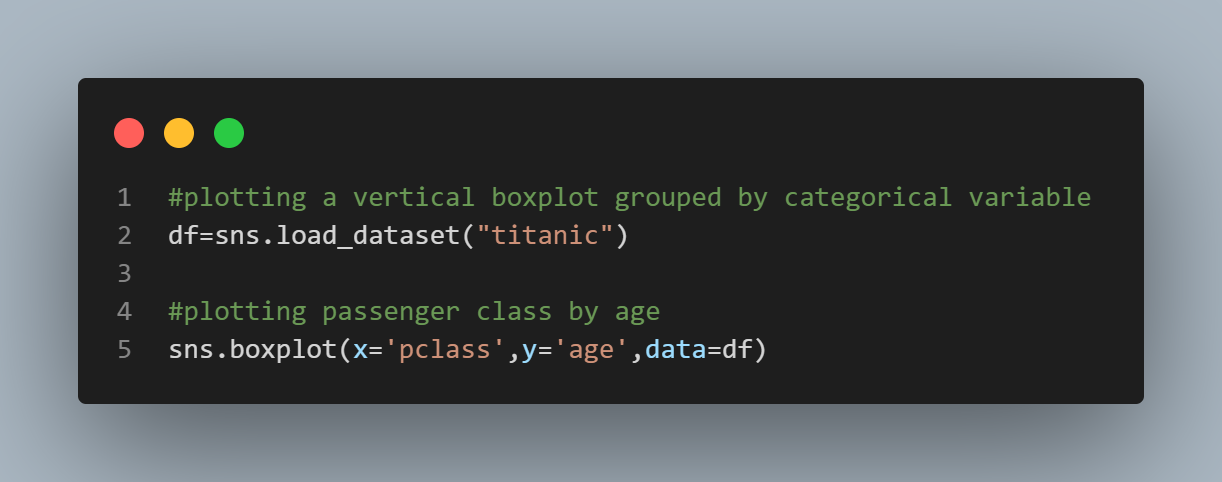
Next, let us look at the distribution of Passenger class (pclass) based on age.
 Code:

#plotting a vertical boxplot grouped by categorical variable

df=sns.load_dataset("titanic")


#plotting passenger class by age

sns.boxplot(x='pclass',y='age',data=df)
Output:

d) Boxplot using plotly
Plotly is a python library that offers visually appealing graphs and plots to the users. To create a boxplot using plotly we make use of the "px.box()" function. In a box plot created by the px.box, the distribution of the column given as y argument is represented. Let us check the distribution of parch based on age using the same titanic dataset.
 Code:

#importing the library

import plotly.express as px


#plotting simple boxplot for parch by age

fig = px.box(df, x="parch", y="age")

fig.show()

Output:

We can even display the underlying data using the "points" argument.
 Code:

#displaying the underlying data in boxplot for parch by age

fig = px.box(df, x="parch", y="age",points="all")

fig.show()

Output:

3) How to make a boxplot in R
Creating boxplots in R is a cakewalk. You can create a boxplot simply by using the boxplot() function.
Syntax: boxplot(x, data, notch, varwidth, names, main)
Parameters:
x -> a vector or a formula
data -> sets the dataframe
notch -> set TRUE to draw a notch
varwidth -> set TRUE to draw width of the box proportionate to the sample size
main -> title of the chart
names -> group labels that will be showed under every boxplot
We will make use of the mtcars dataset that is available by default in R. Let us plot a boxplot to see the relation between miles per gallon(mpg) and the number of cylinders(cyl).
 Code:

#loading the dataset

df <- (mtcars)


#boxplot to find relation between miles per gallon(mpg) and number of cylinders(cyl)

boxplot(mpg ~ cyl, data = df)


#boxplot with notch

boxplot(mpg ~ cyl, data = df, notch = TRUE)

Output:

With notch

4) How to read a boxplot
Now that we have learned how to plot boxplots manually, in python and R, we will learn how to interpret the information from a boxplot.
As mentioned earlier, a boxplot is a method of displaying a five-number summary in a chart. The main part of the chart i.e. the "box" shows the interquartile range, which is the middle portion of the data. The first quartile and the third quartile are located at the box's ends. The minimum is at the far left/bottom of the chart and the maximum is at the far right/top. The median is depicted by a vertical bar in the box's center.
Let us take an example-
We are plotting a boxplot to see the age range of men and women based on their survival.
 Code:

#plotting boxplot using plotly


import plotly.express as px


fig = px.box(df, x="sex", y="age", color="survived")

fig.show()

Output:

We can infer from the above boxplot that -
Children had a good survival rate
Women in the age range of 20-50 had a higher survival rate
As the age increase, the survival rate of men decreases

What Users are saying..

Jingwei Li
ProjectPro is an awesome platform that helps me learn much hands-on industrial experience with a step-by-step walkthrough of projects. There are two primary paths to learn: Data Science and Big Data.... Read More