How to make a contingency table in R
In this recipe, we will learn how to create tables and contingency tables in R, and lastly how to perform the chi-squared test in R.
How to make a contingency table in R
In this tutorial, you will learn –
• How to make a table in R?
• What are contingency tables?
• How to make contingency tables in R?
• Chi-squared test in R
We will make use of the titanic dataset available in the titanic package in R for all the examples. To load the library follow the given steps –
Code:

#installing package

install.packages("titanic")


#loading the package

library(titanic)


#printing first 6 rows of the dataset

head(titanic_train)

Output:
  PassengerId Survived Pclass                                                Name
1           1        0      3                             Braund, Mr. Owen Harris
2           2        1      1 Cumings, Mrs. John Bradley (Florence Briggs Thayer)
3           3        1      3                              Heikkinen, Miss. Laina
4           4        1      1        Futrelle, Mrs. Jacques Heath (Lily May Peel)
5           5        0      3                            Allen, Mr. William Henry
6           6        0      3                                    Moran, Mr. James
     Sex Age SibSp Parch           Ticket    Fare Cabin Embarked
1   male  22     1     0        A/5 21171  7.2500              S
2 female  38     1     0         PC 17599 71.2833   C85        C
3 female  26     0     0 STON/O2. 3101282  7.9250              S
4 female  35     1     0           113803 53.1000  C123        S
5   male  35     0     0           373450  8.0500              S
6   male  NA     0     0           330877  8.4583              Q
How to make a table in R?
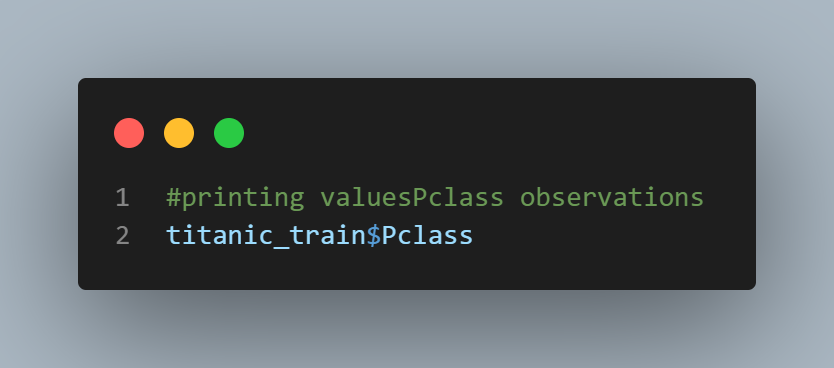
Let us check out the PClass column data of the titanic dataset.
Code:

#printing valuesPclass observations

titanic_train$Pclass
Output:
  [1] 3 1 3 1 3 3 1 3 3 2 3 1 3 3 3 2 3 2 3 3 2 2 3 1 3 3 3 1 3 3 1 1 3 2 1 1 3 3
 [39] 3 3 3 2 3 2 3 3 3 3 3 3 3 3 1 2 1 1 2 3 2 3 3 1 1 3 1 3 2 3 3 3 2 3 2 3 3 3
 [77] 3 3 2 3 3 3 3 1 2 3 3 3 1 3 3 3 1 3 3 3 1 1 2 2 3 3 1 3 3 3 3 3 3 3 1 3 3 3
[115] 3 3 3 2 1 3 2 3 2 2 1 3 3 3 3 3 3 3 3 2 2 2 1 1 3 1 3 3 3 3 2 2 3 3 2 2 2 1
[153] 3 3 3 1 3 3 3 3 3 2 3 3 3 3 1 3 1 3 1 3 3 3 1 3 3 1 2 3 3 2 3 2 3 1 3 1 3 3
[191] 2 2 3 2 1 1 3 3 3 2 3 3 3 3 3 3 3 3 3 1 3 2 3 2 3 1 3 2 1 2 3 2 3 3 1 3 2 3
[229] 2 3 1 3 2 3 2 3 2 2 2 2 3 3 2 3 3 1 3 2 1 2 3 3 1 3 3 3 1 1 1 2 3 3 1 1 3 2
[267] 3 3 1 1 1 3 2 1 3 1 3 2 3 3 3 3 3 3 1 3 3 3 2 3 1 1 2 3 3 1 3 1 1 1 3 3 3 2
[305] 3 1 1 1 2 1 1 1 2 3 2 3 2 2 1 1 3 3 2 2 3 1 3 2 3 1 3 1 1 3 1 3 1 1 3 1 2 1
[343] 2 2 2 2 2 3 3 3 3 1 3 3 3 3 1 2 3 3 3 2 3 3 3 3 1 3 3 1 1 3 3 1 3 1 3 1 3 3
[381] 1 3 3 1 3 2 3 2 3 2 1 3 3 1 3 3 3 2 2 2 3 3 3 3 3 2 3 2 3 3 3 3 1 2 3 3 2 2
[419] 2 3 3 3 3 3 3 3 2 2 3 3 1 3 2 3 1 1 3 2 1 2 2 3 3 2 3 1 2 1 3 1 2 3 1 1 3 3
[457] 1 1 2 3 1 3 1 2 3 3 2 1 3 3 3 3 2 2 3 1 2 3 3 3 3 2 3 3 1 3 1 1 3 3 3 3 1 1
[495] 3 3 1 3 1 3 3 3 3 3 1 1 2 1 3 3 3 3 1 1 3 1 2 3 2 3 1 3 3 1 3 3 2 1 3 2 2 3
[533] 3 3 3 2 1 1 3 1 1 3 3 2 1 1 2 2 3 2 1 2 3 3 3 1 1 1 1 3 3 3 2 3 3 3 3 3 3 3
[571] 2 1 1 3 3 3 2 1 3 3 2 1 2 1 3 1 2 1 3 3 3 1 3 3 2 3 2 3 3 1 2 3 1 3 1 3 3 1
[609] 2 1 3 3 3 3 3 2 3 3 2 2 3 1 3 3 3 1 2 1 3 3 1 3 1 1 3 2 3 2 3 3 3 1 3 3 3 1
[647] 3 1 3 3 3 2 3 3 3 2 3 3 2 1 1 3 1 3 3 2 2 3 3 1 2 1 2 2 2 3 3 3 3 1 3 1 3 3
[685] 2 2 3 3 3 1 1 3 3 3 1 2 3 3 1 3 1 1 3 3 3 2 2 1 1 3 1 1 1 3 2 3 1 2 3 3 2 3
[723] 2 2 1 3 2 3 2 3 1 3 2 2 2 3 3 1 3 3 1 1 1 3 3 1 3 2 1 3 2 3 3 3 2 2 3 2 3 1
[761] 3 3 3 1 3 1 1 3 3 3 3 3 2 3 2 3 3 3 3 1 3 1 1 3 3 3 3 3 3 1 3 2 3 1 3 2 1 3
[799] 3 3 2 2 1 3 3 3 1 3 2 1 3 3 2 3 3 1 3 2 3 3 1 3 1 3 3 3 3 2 3 1 3 2 3 3 3 1
[837] 3 3 3 1 3 2 1 3 3 3 3 3 2 1 3 3 3 1 2 3 1 1 3 3 3 2 1 3 2 2 2 1 3 3 3 1 1 3
[875] 2 3 3 3 3 1 2 3 3 2 3 3 2 1 3 1 3
We have 3 types of classes here. We can check the exact count of each of these classes using the table() function.
Code:

#making a table

table(titanic_train$Pclass)

Output:
  1   2   3
216 184 491
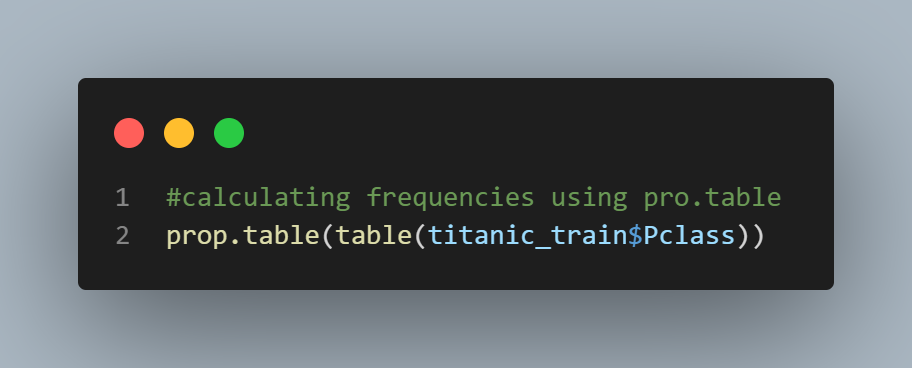
We can use the prop.table() function to display proportions of the total sum.
Code:

#calculating frequencies using pro.table

prop.table(table(titanic_train$Pclass))
Output:
        1         2         3
0.2424242 0.2065095 0.5510662
What are contingency tables?
In statistics, contingency tables are used to summarise the relationship between numerous categorical variables. A contingency table is a form of frequency distribution table that displays two variables at the same time.
How to make contingency tables in R?
Suppose we want to see the joint distribution of two or more variables in our dataset, we can make use of the table() function in R again.
Let us check the relationship between PClass and Survived columns of the titanic dataset.
Code:

#contingency table

table(titanic_train$Pclass,titanic_train$Survived)

Output:
      0   1
  1  80 136
  2  97  87
  3 372 119
You can even get colSums and rolSums value as follows-
Code:

#rowsums and colsums

t1 <- table(titanic_train$Pclass,titanic_train$Survived)

rowSums(t1)

colSums(t1)

Output:
  1   2   3
216 184 491
  0   1
549 342
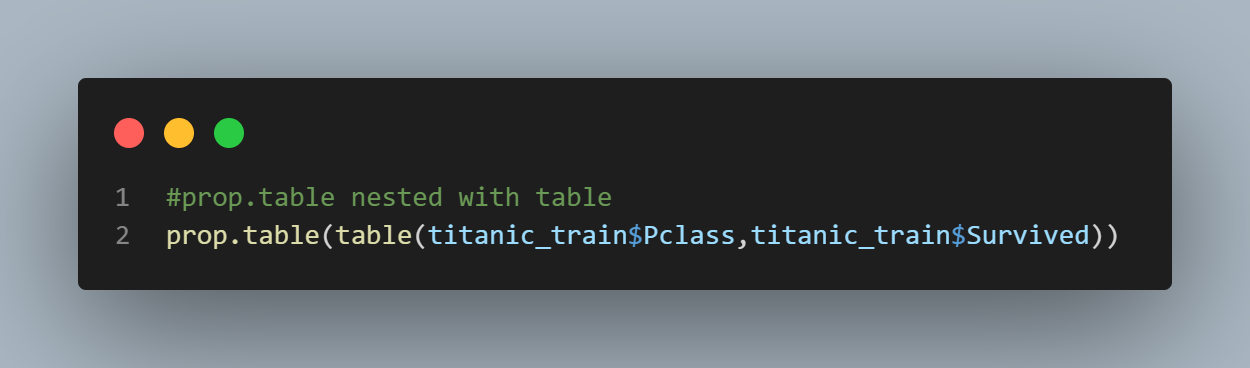
To get to a joint probability distribution, make use of a prop.table() with table().
Code:

#prop.table nested with table

prop.table(table(titanic_train$Pclass,titanic_train$Survived))
Output:
             0          1
  1 0.08978676 0.15263749
  2 0.10886644 0.09764310
  3 0.41750842 0.13355780
We can see that 41% of the passengers were from Class 3 and did not survive.
Chi-squared test in R
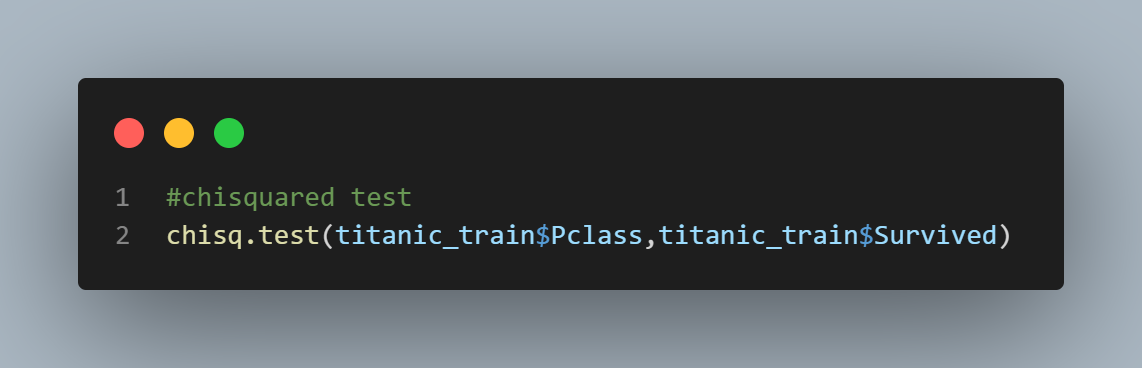
“Are the row and column variables in a contingency table independent or dependent”, is one of the most frequently asked questions. The simplest approach to respond is to conduct a chi-squared test. Let us see how to perform the Chi-squared test in R. We will check if Pclass and Survived are independent.
Code:

#chisquared test

chisq.test(titanic_train$Pclass,titanic_train$Survived)
Output:
	Pearson's Chi-squared test

data:  titanic_train$Pclass and titanic_train$Survived
X-squared = 102.89, df = 2, p-value < 2.2e-16
It is clear from the test that Pclass and Survived are not independent.

What Users are saying..

Abhinav Agarwal
I come from Northwestern University, which is ranked 9th in the US. Although the high-quality academics at school taught me all the basics I needed, obtaining practical experience was a challenge.... Read More