What is Otsu’s Binarization in OpenCV
This recipe explains what is Otsu’s Binarization in OpenCV
Recipe Objective: What is Otsu's Binarization in OpenCV?
Let us take this recipe to understand what is Otsu's Binary Thresholding and how it is useful.
Learn to Implement Deep Learning Techniques for Medical Image Segmentation
Table of Contents
Step 1: Import the necessary libraries and read the image
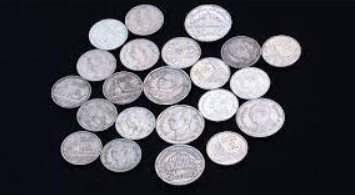
Let us first import the required libraries and read the images. The image that we are using here is the one shown below. It is crucial to read the image in grayscale format to perform thresholding.

import cv2

from matplotlib import pyplot as plt

image = cv2.imread('coins.jpg',0)
Step 2: Otsu's Binarization
In the Simple Thresholding technique, we define a global threshold value for the image arbitrarily. But how do we know if that is the best value or obtain the best threshold value? We have to try various threshold values and find which one works best for the image. The only answer is the trial and error method.
But suppose we have a Bimodal image (A bimodal image with two dominant peaks in its histogram or, to put it in simple terms, it is a type of image whose pixel values are distributed over two dominating regions). In that case, we can use Otsu's Binarization technique which assigns a threshold value that is approximately in the middle of the two peaks automatically.
We can use the usual cv2.threshold() function with an extra flag of cv2.THRESH_OTSU and set the threshold value to 0 to perform Otsu's Binarization. The optimal threshold value is returned as the first output retVal.
retVal,th = cv2.threshold(image,0,255,cv2.THRESH_BINARY+cv2.THRESH_OTSU)
Step 3: Display the output
Let us use the matplotlib library to display the output.
plt.figure(figsize=(13,9))

plt.subplot(1,2,1)
plt.imshow(image,'gray')
plt.title('Original Image')
plt.xticks([])
plt.yticks([])

plt.subplot(1,2,2)
plt.imshow(th,'gray')
plt.title("Otsu's Binary Thresholding")
plt.xticks([])
plt.yticks([])

plt.tight_layout()
plt.show()
Output:

Let us also see what the optimal threshold value that was set was.
print(f'The optimum threshold value is {retVal}')
Output:
The optimum threshold value is 102.0
Download Materials

What Users are saying..

Ray han
I think that they are fantastic. I attended Yale and Stanford and have worked at Honeywell,Oracle, and Arthur Andersen(Accenture) in the US. I have taken Big Data and Hadoop,NoSQL, Spark, Hadoop... Read More