Perform Window Operations during Spark Structured Streaming
This recipe helps you to perform Window Operations during Spark Structured Streaming. Spark Streaming is a scalable, high-throughput, fault-tolerant streaming processing system that supports both batch and streaming workloads. It extends the core Spark API to process real-time data from sources like Kafka, Flume.
Recipe Objective: How to perform Window Operations during Spark Structured Streaming?
Window operations are very similar to groupBy operations. In groupBy, aggregation is based on the specified group or key, while in window operations, aggregation is based on event windows. Spark supports two types of windows: Tumbling window and Sliding window. In this recipe, we will discuss them in detail.
Working with streaming data is different from working with batch data. With streaming data, we will never have complete data for analysis, as data is continuously coming in. Apache Spark provides a streaming API to analyze streaming data in pretty much the same way we work with batch data. Apache Spark Structured Streaming is built on top of the Spark-SQL API to leverage its optimization. Spark Streaming is an engine to process data in real-time from sources and output data to external storage systems.
Spark Streaming is a scalable, high-throughput, fault-tolerant streaming processing system that supports both batch and streaming workloads. It extends the core Spark API to process real-time data from sources like Kafka, Flume.
Learn Spark SQL for Relational Big Data Procesing
Table of Contents
Implementation Info:
- Databricks Community Edition click here
- Spark-Scala
- msft_2012_2015 file click here
- msft_2016_2017 file click here
- storage - Databricks File System(DBFS)
Step 1: Uploading data to DBFS
Follow the below steps to upload data files from local to DBFS
- Click create in Databricks menu
- Click Table in the drop-down menu, it will open a create new table UI
- In UI, specify the folder name in which you want to save your files.
- click browse to upload and upload files from local.
- path is like /FileStore/tables/your folder name/your file
Refer to the image below for example

Step 2: Reading CSV Files from Directory
Spark Streaming has three major components: input sources, processing engine, and sink(destination). Input sources generate data like Kafka, Flume, HDFS/S3/any file system, etc. Spark Streaming engine processes incoming data from various input sources. Sinks store processed data from Spark Streaming engines like HDFS/File System, relational databases, or NoSDB'sB's.
Here we are using the File system as a source for Streaming. Spark reads files written in a directory as a stream of data. Files will be processed in the order of file modification time. If the latestFirst is set, the order will be reversed. Supported file formats are text, CSV, JSON, ORC, Parquet.
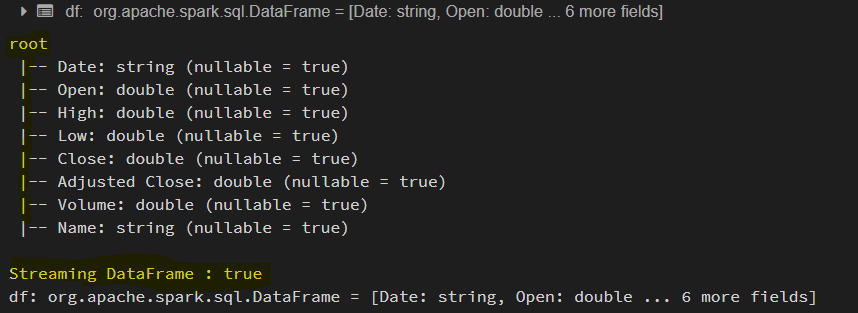
In our example the CSV Files are placed in /FileStore/tables/stream_csv directory.The data in the files is stock data. In databricks, the notebook itself invokes a spark session when it is executed. So, we need not create a spark session explicitly. Here we define the custom schema and impose it on the data while we read the CSV files. And to identify whether a DataFrame/Dataset has streaming data or not by using df.isStreaming.
Here while reading files from the directory, we are setting a property maxFilesPerTrigger = 2. Such that spark reads two files per micro-batch. And we are defining a method getFileName to get the stock name from the file name.
import org.apache.spark.sql.SparkSession
import org.apache.spark.sql.functions._
import org.apache.spark.sql.Column
import org.apache.spark.sql.types.{DoubleType, IntegerType, LongType, StringType, StructField, StructType}

// Create Spark Session
val spark = SparkSession.builder().master("local").appName("Spark Stream UDF")
                        .getOrCreate()

val schema = StructType(List(
      StructField("Date", StringType, true),
      StructField("Open", DoubleType, true),
      StructField("High", DoubleType, true),
      StructField("Low", DoubleType, true),
      StructField("Close", DoubleType, true),
      StructField("Adjusted Close", DoubleType, true),
      StructField("Volume", DoubleType, true)))

def getFileName : Column = {
      val file_name = reverse(split(input_file_name(), "/")).getItem(0)
      split(file_name, "_").getItem(0)
    }

// Create Streaming DataFrame by reading data from directory.
 val df = spark
      .readStream
      .option("maxFilesPerTrigger", 2) // This will read maximum of 2 files per mini batch. However, it can read less than 2 files.
      .option("header", true)
      .schema(schema)
      .csv("/FileStore/tables/stream_csv")
      .withColumn("Name", getFileName)
        .select("Name", "Date","Open", "High", "Low", "Close", "Adjusted Close", "Volume")
df.printSchema()
println("Streaming DataFrame : " + df.isStreaming)
Refer to the below image for reference
Step 3: Tumbling window
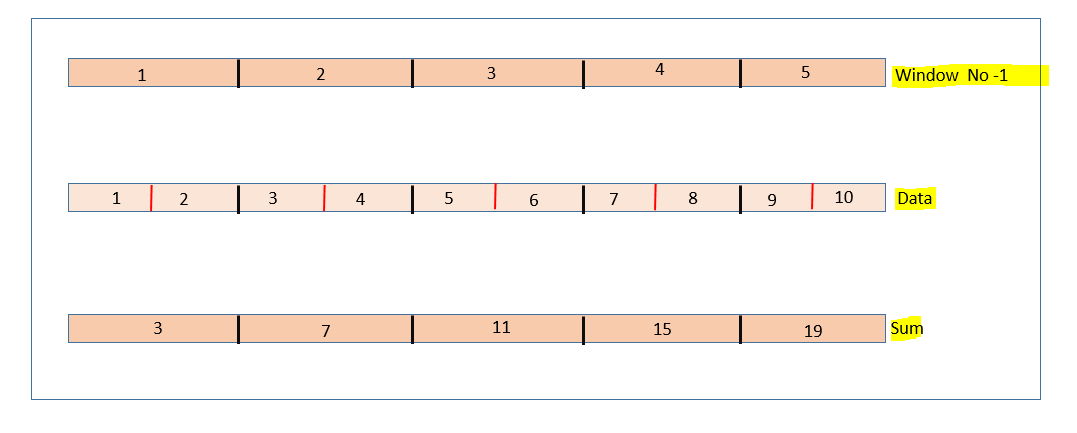
Tumbling windows are non-overlapping, which means each data point will be part of only one window. Here the window size is two, and we have five non-overlapping windows along with the sum of the elements in each window. Also, we can verify that none of the elements are overlapping between windows. Now let us define one in our streaming application. We can use a window function and specify the DateTime column and window duration, say 2 minutes or 30 seconds or 1 hour or five days. Let's consider the "DF" defined in the above section and apply a window function.
// Display Data to Console with Aggregation.
val tumbling_df = df.select("Name", "Date", "Open", "High", "Low")
.groupBy(window(col("Date"), "10 days"), col("Name")) // Tumbling window : where the 2 consecutive windows are non-overlapping.
.agg(max("High").as("Max"))
.orderBy(col("window.start"))
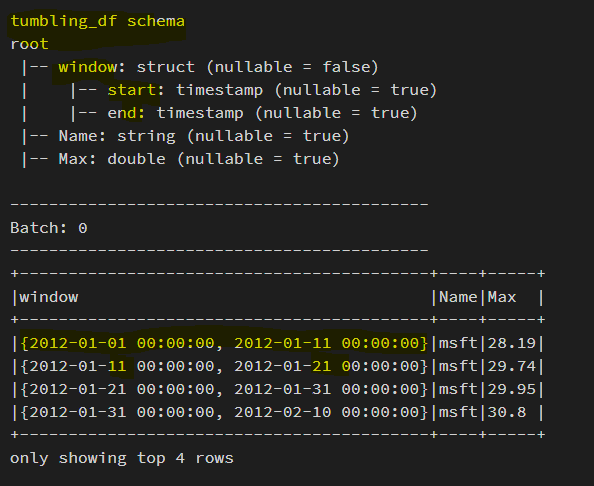
println("tumbling_df schema")
tumbling_df.printSchema()
tumbling_df.writeStream
.outputMode("complete")
.option("truncate", false)
.option("numRows", 4)
.format("console")
.start()
.awaitTermination()
Let's have a look at the first few records from the output of a micro-batch. Here we used the Date column with ten days as window duration and sorted the result by window start time to check the non-overlapping behavior of tumbling windows. We can check the window size in the window column and see that none of the windows overlap.
Step 4: Sliding window
These are overlapping windows. Let's first try to understand with a simple example of numbers from 1–10. This window will slide instead of tumbling on the data. We can specify the level of sliding needed.
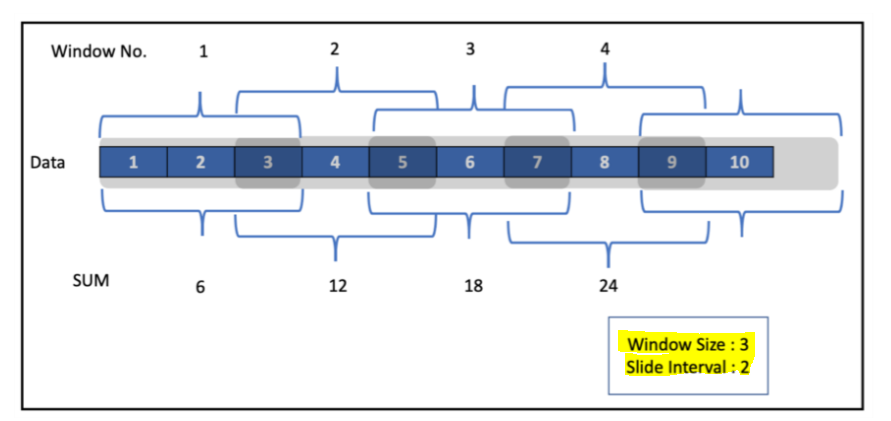
Here we have defined the window size as three and slide interval as 2. As we can see in the snapshot above, these windows overlap. For example, the number 3 is present in both Windows 1 and 2. To define a sliding window, along with DateTime and Window Size in the window function, we specify slide Duration as the third argument. Let's try to perform a sliding window operation in our streaming application.
// Display Data to Console with Aggregation.
val tumbling_df = df.select("Name", "Date", "Open", "High", "Low")
                     .groupBy(window(col("Date"), "10 days"), col("Name")) // Tumbling window : where the 2 consecutive windows are non-overlapping.
                     .agg(max("High").as("Max"))
                            .orderBy(col("window.start"))

println("tumbling_df schema")
tumbling_df.printSchema()

tumbling_df.writeStream
           .outputMode("complete")
           .option("truncate", false)
           .option("numRows", 4)
           .format("console")
           .start()
           .awaitTermination()
We used five days as our slide duration. And window size as 10. It is observed that there is an overlap between the windows.
Conclusion:
Here we learned how to perform window operations over the streaming dataframes. We understood tumbling and sliding windows and their difference with working examples.
Download Materials

What Users are saying..

Gautam Vermani
Having worked in the field of Data Science, I wanted to explore how I can implement projects in other domains, So I thought of connecting with ProjectPro. A project that helped me absorb this topic... Read More