Window function in Hive LEAD LAG FIRST VALUE LAST VALUE
This recipe helps you how to work with windowing functions in Hive which are LEAD LAG FIRST_VALUE and LAST_VALUE and how to use them
Recipe Objective: How to work with windowing functions in Hive- LEAD, LAG, FIRST_VALUE, LAST_VALUE?
In this recipe, we will work with windowing functions in Hive - LEAD, LAG, FIRST_VALUE, LAST_VALUE.
Build a Real-Time Dashboard with Spark, Grafana and Influxdb
Table of Contents
Prerequisites:
Before proceeding with the recipe, make sure Single node Hadoop and Hive are installed on your local EC2 instance. If not already installed, follow the below link to do the same.
Steps to set up an environment:
- In the AWS, create an EC2 instance and log in to Cloudera Manager with your public IP mentioned in the EC2 instance. Login to putty/terminal and check if HDFS and Hive are installed. If not installed, please find the links provided above for installations.
- Type “<your public IP>:7180” in the web browser and log in to Cloudera Manager, where you can check if Hadoop is installed.
- If they are not visible in the Cloudera cluster, you may add them by clicking on the “Add Services” in the cluster to add the required services in your local instance.
Working with windowing functions in Hive:
Windowing allows features to create a window on the data set to operate analytical functions such as LEAD, LAG, FIRST_VALUE, and LAST_VALUE. The syntax for the query is given below:
SELECT <columns_name>, <analytical function>(column_name) OVER (<windowing specification>) FROM <table_name>
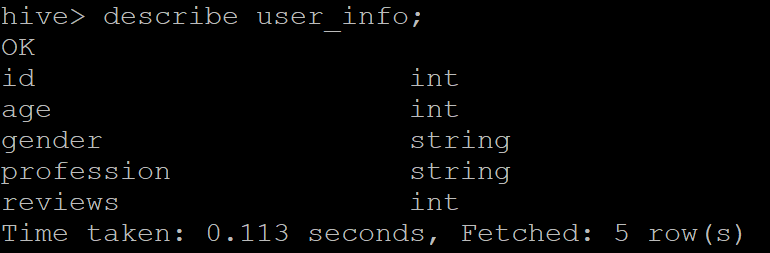
Throughout this recipe, we used the “user_info” table present in our database. Here, the windowing specification includes PARTITION BY that takes a column(s) of the table as a reference, ORDER BY specifies the order of column(s), ascending, by default, and frame that defines the boundary of the frame by start and end value. Following is the schema of the table.
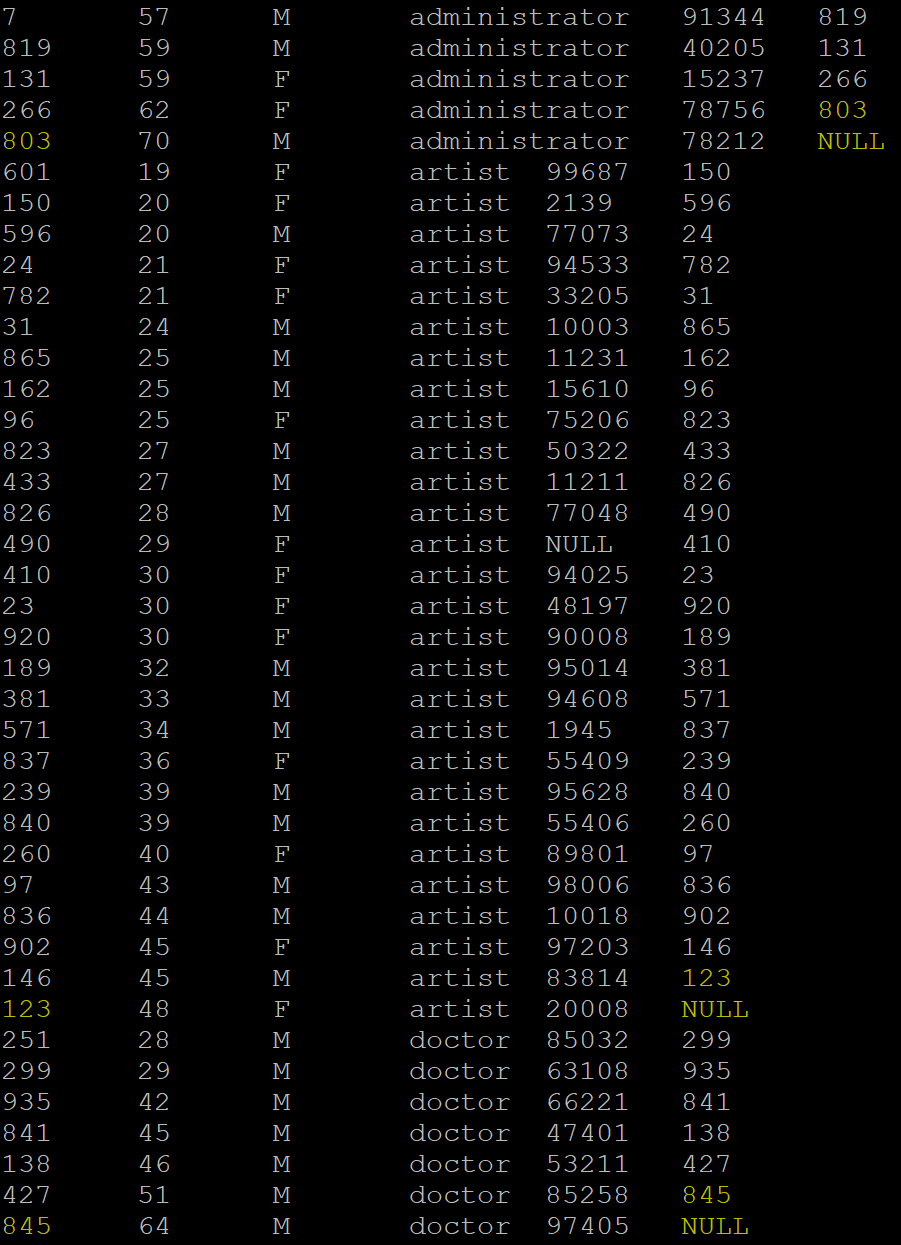
LEAD: It is an analytics function used to return the data from the next set of rows. By default, the lead is of 1 row, and it will return NULL if it exceeds the current window. Here is the output of when the “id” column is passed to the LEAD() function by partitioning the table over the “profession” of the user. We then printed it in the ascending order of their “age.”
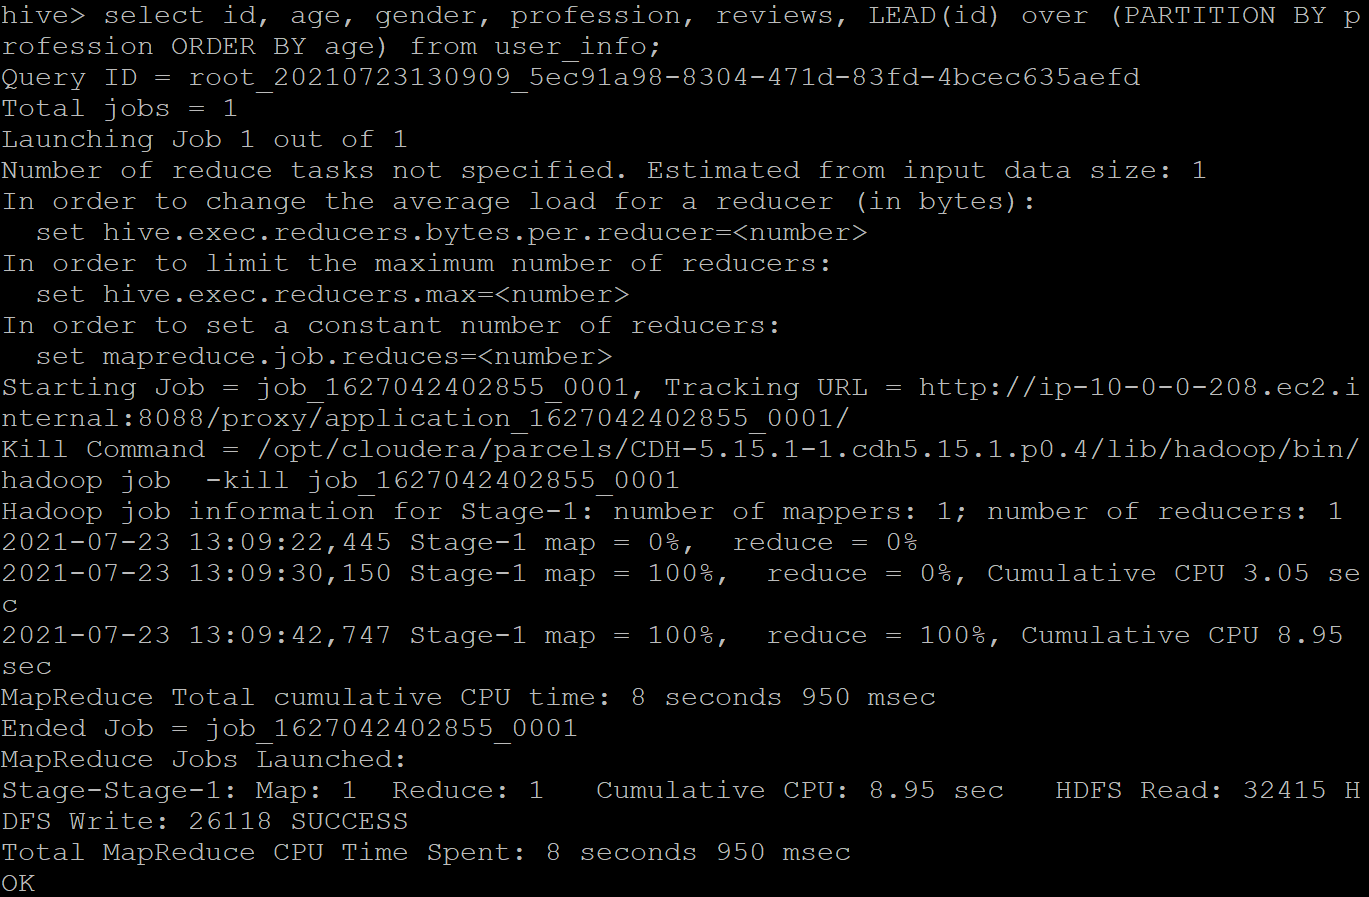
Sample output:
LAG: It is the opposite of the LEAD function; it returns the data from the previous data set. By default, the lag is of 1 row and returns NULL if the lag for the current row is exceeded before the beginning of the window. Following is the output where we passed the “id” column to the LAG() function by partitioning the table over the “profession” of the user and printing in the ascending order of their “age.”
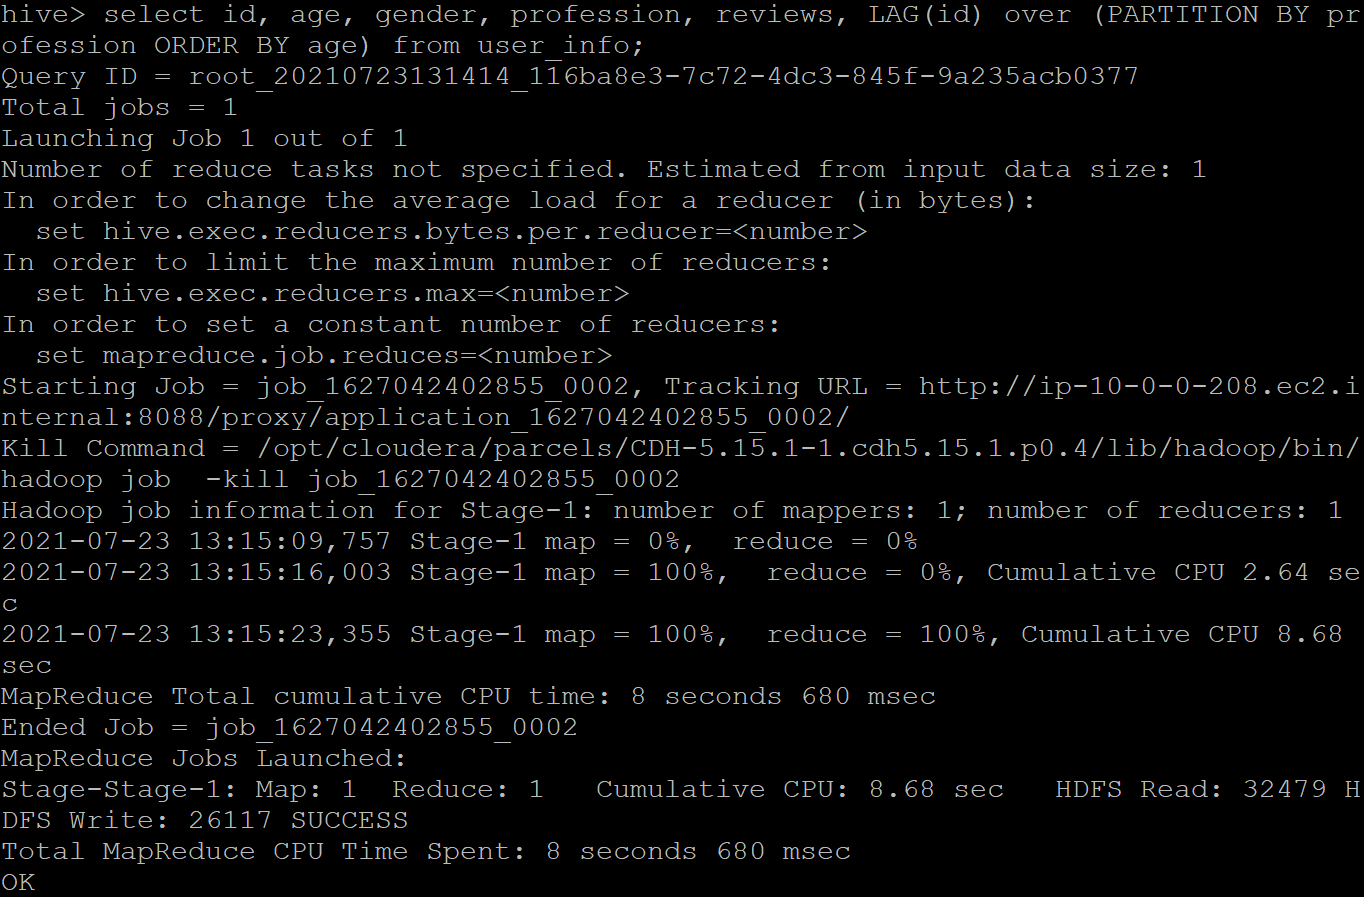
Sample output:
FIRST_VALUE: This function returns the value from the first row in the window based on the clause and is assigned to all the rows of the same group. Following is the output where we passed the “id” column to the FIRST_VALUE() function by partitioning the table over the “profession” of the user and printing in the ascending order of their “age.”

Sample output:

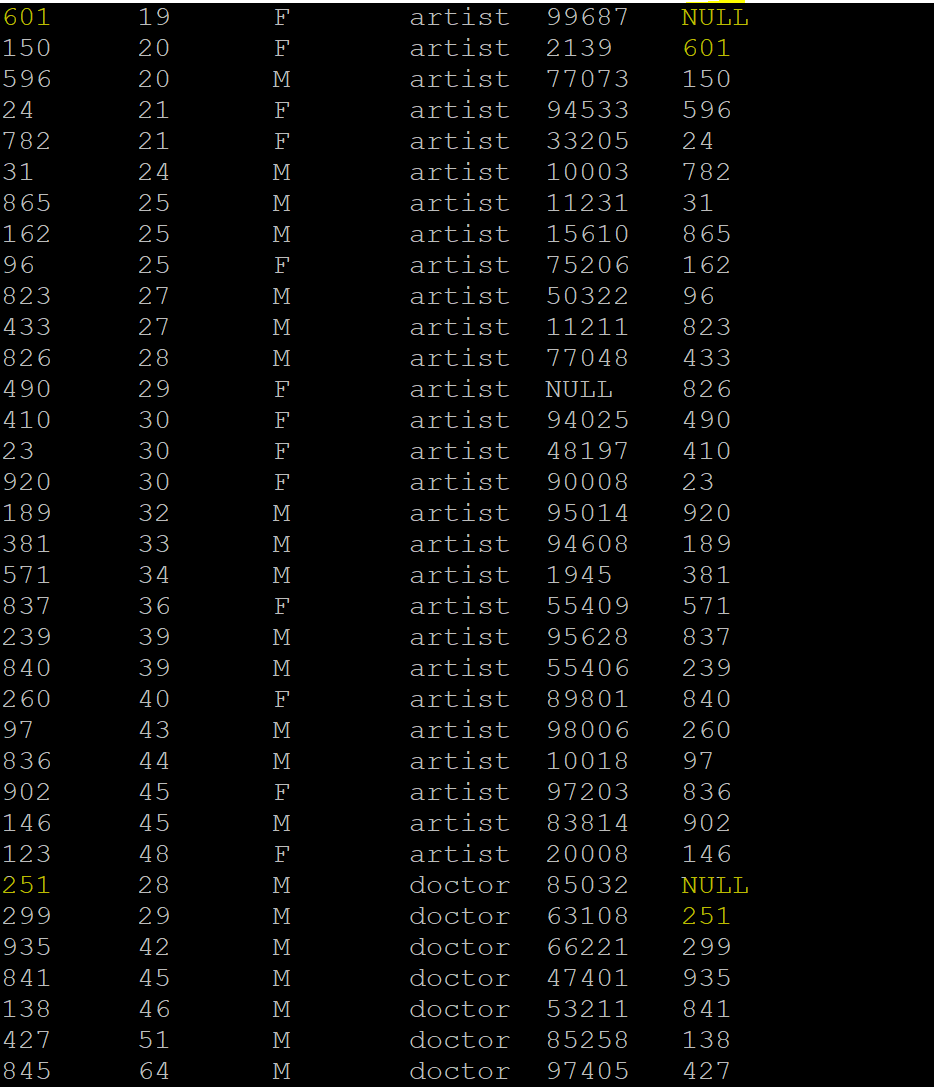
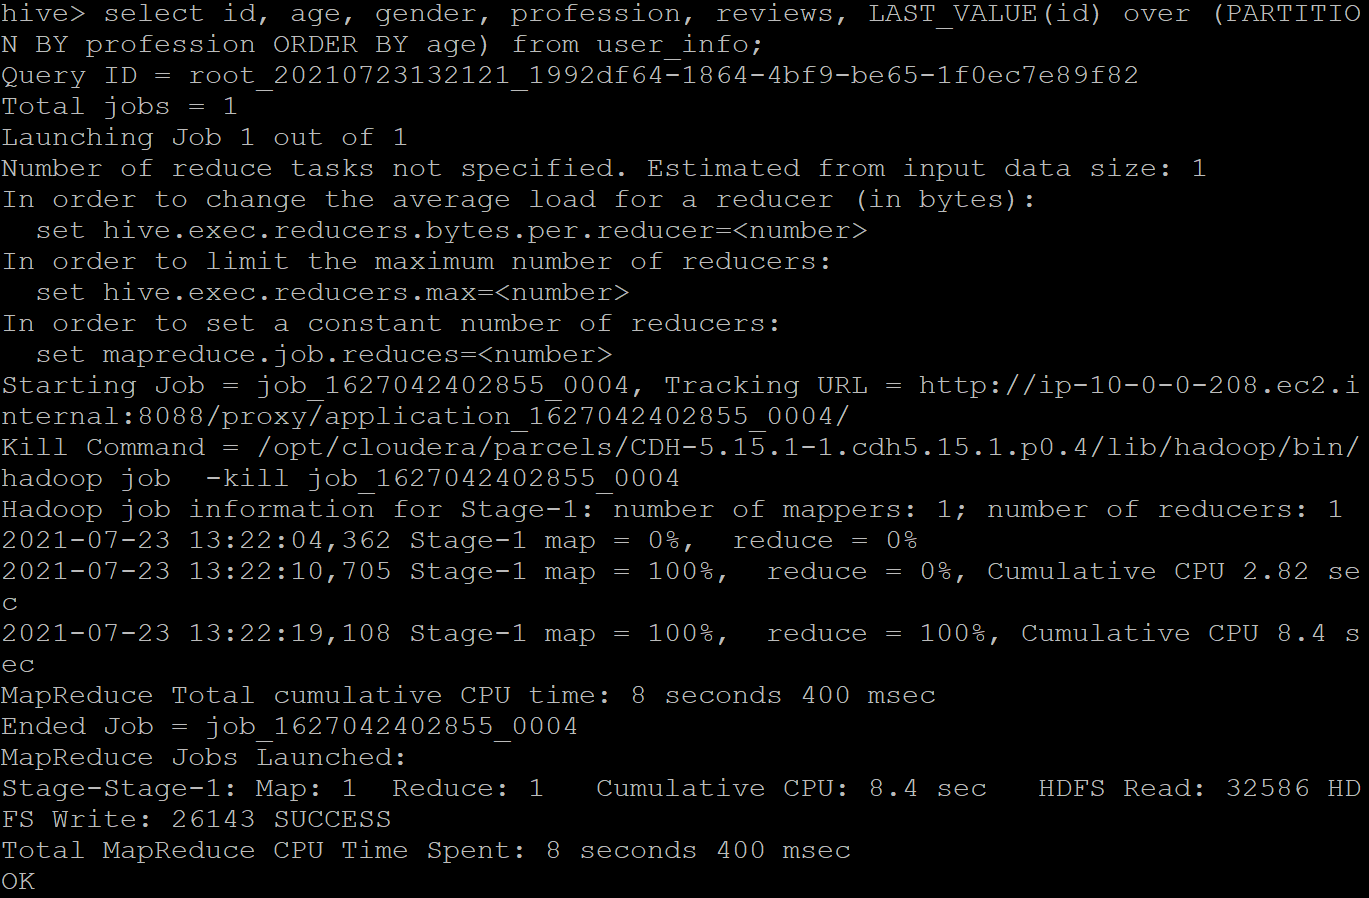
LAST_VALUE: It is the opposite of FIRST_VALUE; it returns the value from the last row in a window based on the clause and is assigned to all the rows of the same group. Following is the output where we passed the “id” column to the LAST_VALUE() function by partitioning the table over the “profession” of the user and printing in the ascending order of their “age.”
Sample output:
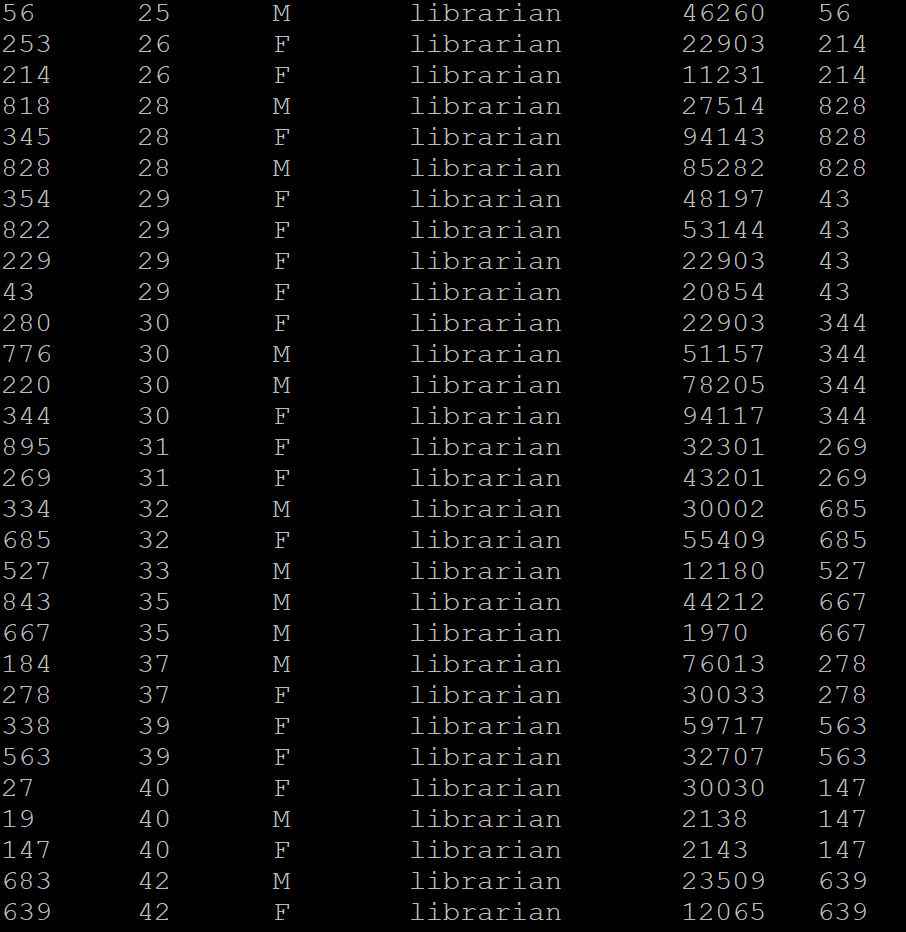
Here, the employees of the same age are assigned the value of that emp_id who is last in that age group.

What Users are saying..

Anand Kumpatla
ProjectPro is a unique platform and helps many people in the industry to solve real-life problems with a step-by-step walkthrough of projects. A platform with some fantastic resources to gain... Read More